Daily Forex Market Preview
The U.S. dollar was supported by comments from President Trump who said that he would announce some new tax plans in the coming weeks. His comments stoked expectations from investors about the much talked about plans for tax breaks and fiscal stimulus spending which wasn't mentioned so far in his term.
The ICE Futures U.S. dollar index was bullish posting a strong reversal off the 100.00 support level as a result and shows the potential for further upside in prices. The U.S. dollar closed in the green against most of the currencies yesterday, but was weaker against the Mexican peso, which rose 0.60% on a 50 basis point rate hike and the Turkish lira, which jumped 0.98%.
Looking ahead the top events to watch today are the manufacturing, industrial and construction reports from the UK while in the North American trading session, Canada's monthly jobs report is expected.
EUR/USD intra-day analysis

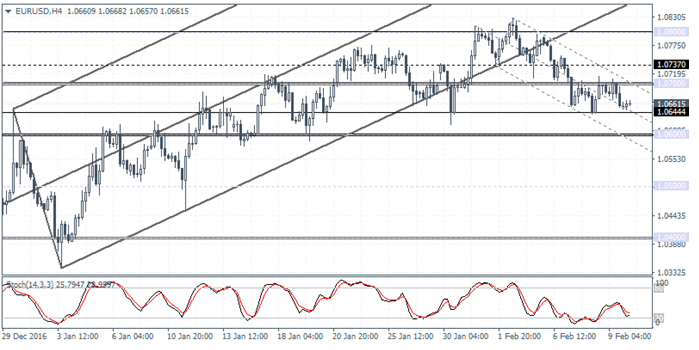
EUR/USD (1.0661):The bearish inside bar formed yesterday in EUR/USD is likely to signal continuation to the downside, although there is scope for the price to remain consolidating within the inside bar. The downside target to 1.0600 remains in place provided the support seen at 1.06444 is cleared. This support level is turning out to be strong with the decline in prices being supported twice at this level so far. The 4-hour Stochastics is, however, showing the potential for a near term upside in prices as an alternative view. The slight higher low in EUR/USD supports this bias, but further confirmation is needed. To the upside 1.0700 - 1.0737 is the resistance level to watch for.
GBP/USD intra-day analysis

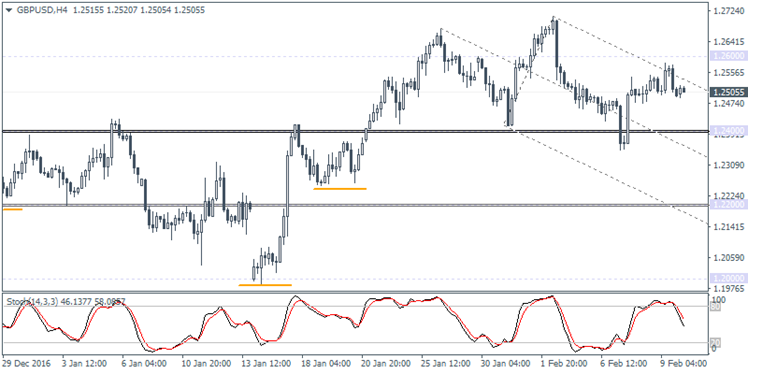
GBP/USD (1.2505): posted a strong rally yesterday rising briefly above 12551, but the cable quickly gave up the gains. The reversal, which comes near the upper median line signals the potential move to the downside as GBP/USD will test support at 1.2400. This view is turning out to be increasingly likely as the upside bias to 1.2800 remains intact while the retest to 1.2400 will see strong support being established. This support level had already been tested just last week. On the economic front, the main event risk will be the manufacturing production report alongside construction and industrial output coming out later today. BoE’s Carney spoke yesterday but failed to make any references to monetary policy.
XAU/USD intra-day analysis

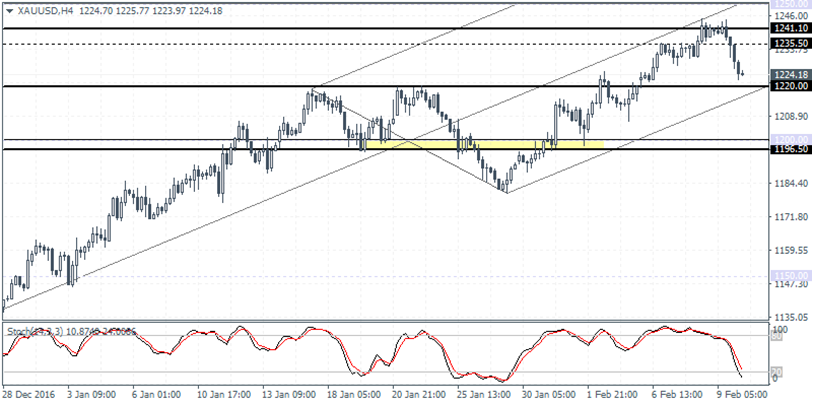
XAU/USD (1224.18):Gold prices posted some declines yesterday after price failed to break above the 1241.00 resistance level, mentioned in yesterday's commentary. The decline in prices saw a break down towards 1225.00 and gold prices are now within grasp of testing the 1220.00 support level which makes for a good buying level. Expect to see a bounce in prices to the upside as resistance zone is likely to be formed near 1241 - 1235 levels. A move to the downside from here on could see the retest of 1220 support followed by 1200.00.
