
Gold continues to lose ground, as the metal has recorded four straight losing days. In Tuesday’s North American session, the spot price for one ounce of gold is $1283.72, down 0.23% on the day. It has been a miserable March for gold, which has declined 2.2%, and the metal has dropped to its lowest level since late January. On the fundamental front, ISM Non-Manufacturing PMI improved sharply to 59.7 points, up from 56.7 in the previous release. This marked a 3-month high. New Home Sales slipped to 621 thousand but managed to beat the forecast of 597 thousand. On Wednesday, the U.S. releases ADP nonfarm payrolls.
The trade war between the U.S. and China may not be over, but there are clear signs that tensions between the two super-economies have eased considerably. Growing risk appetite has been bad news for gold, as the safe-haven asset thrives at periods of uncertainty and handwringing. If the positive momentum continues, President Trump and Chinese President Xi could sign a trade agreement in late March. Still, it’s unclear what the agreement will look like, as the sides have been very tight-lipped. Investors will be most concerned as to whether U.S. tariffs on Chinese products would be eliminated immediately or phased out over time. If speculation rises that a breakthrough is imminent, gold will continue to look less unattractive to investors open to risk.
The focus will be on U.S. employment numbers for the remainder of the week, starting with ADP nonfarm payrolls on Wednesday. Analysts are expecting mixed numbers on Friday. Wage growth is expected to improve to 0.3%, but nonfarm payrolls are projected to slide to 185 thousand, after a strong gain of 304 thousand in the previous release. The unemployment rate has been at record lows and is expected to dip to a sizzling 3.9% in the February report.
XAU/USD Fundamentals
Tuesday (March 5)
- 7:30 US FOMC Member Rosengren Speaks
- 9:45 US Final Services PMI. Estimate 56.2. Actual 56.0
- 10:00 US ISM Non-Manufacturing PMI. Estimate 57.4. Actual 59.7
- 10:00 US New Home Sales. Estimate 597K. Actual 621K
- 10:01 US IBD/TIPP Economic Optimism. Estimate 51.2. Actual 55.7
- 14:00 US Federal Budget Balance. Estimate 17.3B
Wednesday (March 6)
- 8:15 US ADP (NASDAQ:ADP) Nonfarm Employment Change. Estimate 190K
*All release times are EST
*Key events are in bold
XAU/USD for Tuesday, March 5, 2019
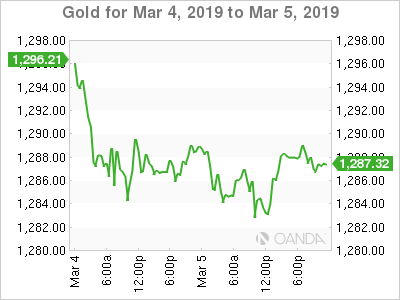
XAU/USD March 5 at 12:15 EST
Open: 1293.31 High: 1297.12 Low: 1382.95 Close: 1288.58
XAU/USD Technical
| S3 | S2 | S1 | R1 | R2 | R3 |
| 1243 | 1261 | 1284 | 1306 | 1326 | 1344 |
XAU/USD posted slight gains in the Asian session but retracted in European trade. The pair has edged lower in North American trade
- 1284 is providing support
- 1306 is the next resistance line
- Current range: 1284 to 1306
Further levels in both directions:
- Below: 1284, 1261 and 1243
- Above: 1306, 1326, 1344 and 1365