Get 40% Off
⚠ Earnings Alert! Which stocks are poised to surge?
See the stocks on our ProPicks radar. These strategies gained 19.7% year-to-date.
Unlock full list

Gold Shines On Weaker USD; Oil Consolidates

Published 07/18/2017, 12:01 AM
Updated 07/09/2023, 06:31 AM

Gold was the main beneficiary of the U.S. dollar's woes overnight as oil consolidatesrecent gains.

Oil

Crude paused for breath overnight with both Brent and WTI trading in a one-dollar range. It is perhaps unsurprising given the whipsaw nature of the market lately and no doubt open positioning from traders either long or short is much reduced.

Tonight’s American Petroleum Institutes (API) inventory numbers should spark some life back into trading with perhaps the top side more vulnerable if we get another larger than expected drawdown. Both contracts are trading quietly in early Asia near to their New York closes with Brent spot at 48.45 and WTI spot at 46.15 respectively.

Brent spot has initial resistance at 49.15 followed by the more important 49.70/50.00 region. Support appears at 48.00 and then 47.00.
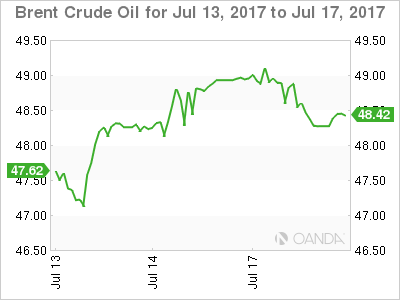
Brent Hourly Chart

WTI spot has initial resistance at 47.00/47.20 with a close above implying a technical move to test the 100-day moving average at 48.00. Support is just below at 45.80 followed by the more significant 45.00 area.
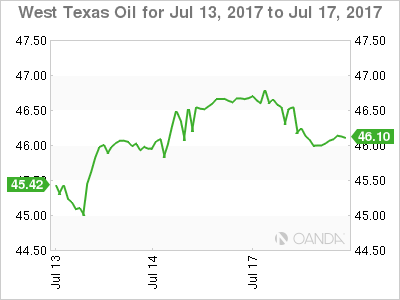
WTI Hourly Chart

Gold

Gold continued its positive tone overnight, albeit at a more subdued pace than Friday’s rally. Gold traded to a high of around 1236.00, and in the process, comfortably closed above the 200-day moving average at 1230.50, a bullish technical development.

With the Street repricing its U.S. interest rate outlook following soft data and a dovish Yellen, and with President Trump’s reflationary reforms seemingly lost in the legislative Bermuda Triangle of Congress, a weaker U.S. dollar should continue to support gold.

Gold trades positively in Asia, up four dollars at 1237.50 with early Asia physical demand evident. Initial resistance is at the 1240.00 region followed by the 100-day moving average at 1247.50. Intraday support appears at 1232.80 followed by the 1230.00 area.
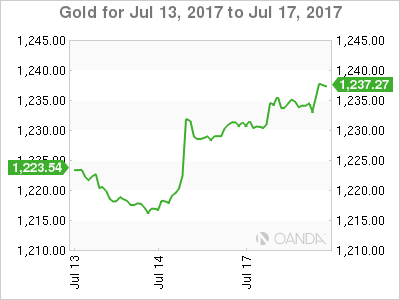
Gold Hourly Chart

Original post

Latest comments

Risk Disclosure: Trading in financial instruments and/or cryptocurrencies involves high risks including the risk of losing some, or all, of your investment amount, and may not be suitable for all investors. Prices of cryptocurrencies are extremely volatile and may be affected by external factors such as financial, regulatory or political events. Trading on margin increases the financial risks.
Before deciding to trade in financial instrument or cryptocurrencies you should be fully informed of the risks and costs associated with trading the financial markets, carefully consider your investment objectives, level of experience, and risk appetite, and seek professional advice where needed.
Fusion Media would like to remind you that the data contained in this website is not necessarily real-time nor accurate. The data and prices on the website are not necessarily provided by any market or exchange, but may be provided by market makers, and so prices may not be accurate and may differ from the actual price at any given market, meaning prices are indicative and not appropriate for trading purposes. Fusion Media and any provider of the data contained in this website will not accept liability for any loss or damage as a result of your trading, or your reliance on the information contained within this website.
It is prohibited to use, store, reproduce, display, modify, transmit or distribute the data contained in this website without the explicit prior written permission of Fusion Media and/or the data provider. All intellectual property rights are reserved by the providers and/or the exchange providing the data contained in this website.
Fusion Media may be compensated by the advertisers that appear on the website, based on your interaction with the advertisements or advertisers.
© 2007-2024 - Fusion Media Limited. All Rights Reserved.