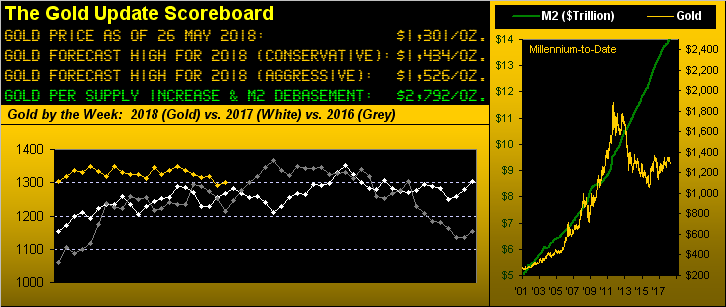
Clearly our theme month-to-date has been how poorly Gold has proven itself to be over many a May past, price having not sported for any of them a net gain of even just 1% since 2010: Gold's average net change for the past seven Mays is a paltry -2.9%. Now with just a few trading days left in this May's balance, Gold has been down as much as -2.7% and at present is -1.1%, having settled the week yesterday (Friday) at 1301. Not much fun.
That said, should seasonality repeat itself, the above weekly Gold tracks, one may construe, suggest higher prices shall soon ensue, right in line with what we wrote a week ago that "Gold will test the support of The Box (1280-1260) -- and successfully hold therein for the year's low before the ascent to the 1400s." -- that barring a year-end fallout as we saw in 2016, which we have to believe shan't be seen. We thus think that now Gold is seeking its year's low.
Still, week-in and week-out, indeed month-in and year-out, we wave the Gold pom-poms toward staying the Gold course for all the rational reasons in the world, the primary one being currencies' debasement, which is the cornerstone element of the "3Ds" that also include debt and derivatives, further expanded with reader contributions to include default and dishonesty, in toto of which makes us look at Gold's lowly price and exclaim "damn!". As we oft quip, 'tis diabolical.
But for all the pro-Gold digital ink being continuously penned 'round the globe, also as we pointed out a week ago, 26% of Gold's daily settles over the past eight years have been in the tight range of 1260-1299. Diabolical indeed. 'Tis been like cheering time and again for a boulder mired in hardened muck on a flat field to suddenly just starting rolling along in some desired direction. Cue Einstein's description of insanity.
'Course, the great Gold boulder shall eventually respond to divine intervention (aka "enlightened buying"). Back in the earliest days of The Gold Update, in chatting with the person who inspired it all 'twas said that "One day we'll wake up and Gold will be $1,000 higher than where it closed yesterday." Given all those d-words, could that actually happen, exchange limits notwithstanding?
Since Nixon nixed the Gold Standard, price's largest daily net gain by both points and percentage was +70.2 (+11.0%) on 29 January 1980. More "realistically" -- because it has happened -- you'll recall Gold's largest yearly net gain came in 1979: +312 points, a stagflationarily sparkling +136.2%. From current levels, for Gold to gain 1,000 points in one day means the world shall have ended, ("Dow up 2"); instead for Gold to again double as it did in '79 over the course of one year would at least get price back in line with debasement. Wave those pom-poms.
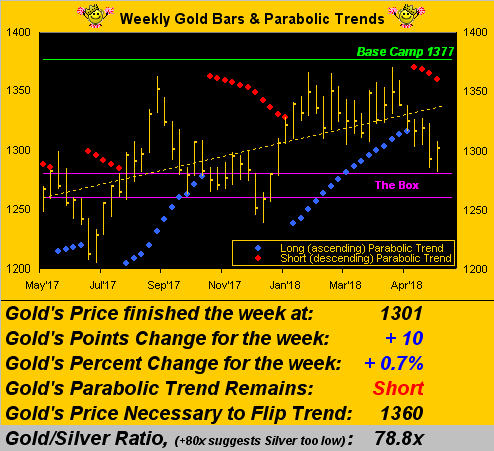
As thus we cheer for the end of May, its downward drag on Gold stands stark as we here see in the weekly bars, the red dots of parabolic Short trend perfectly having commenced their descent back when the month began. And yet the great dual barrier of support -- Neverland (aka "The Whiny 1290s) and The Box (1280-1260) -- are doing their diligent duty. Better to be above 'em than below 'em:
Meanwhile we've received the 01/02 meeting minutes form the Federal Open Market Committee. Rightly, they seem calm on inflation, the months' Consumer Price Index readings year-to-date so far being +0.5%, +0.2%, -0.1% and +0.2%. Wrongly, they seem keen on nevertheless nicking up their Bank's Funds Rate come 13 June into the 1.75%-2.00% target range.
"Why 'wrongly', mmb?"
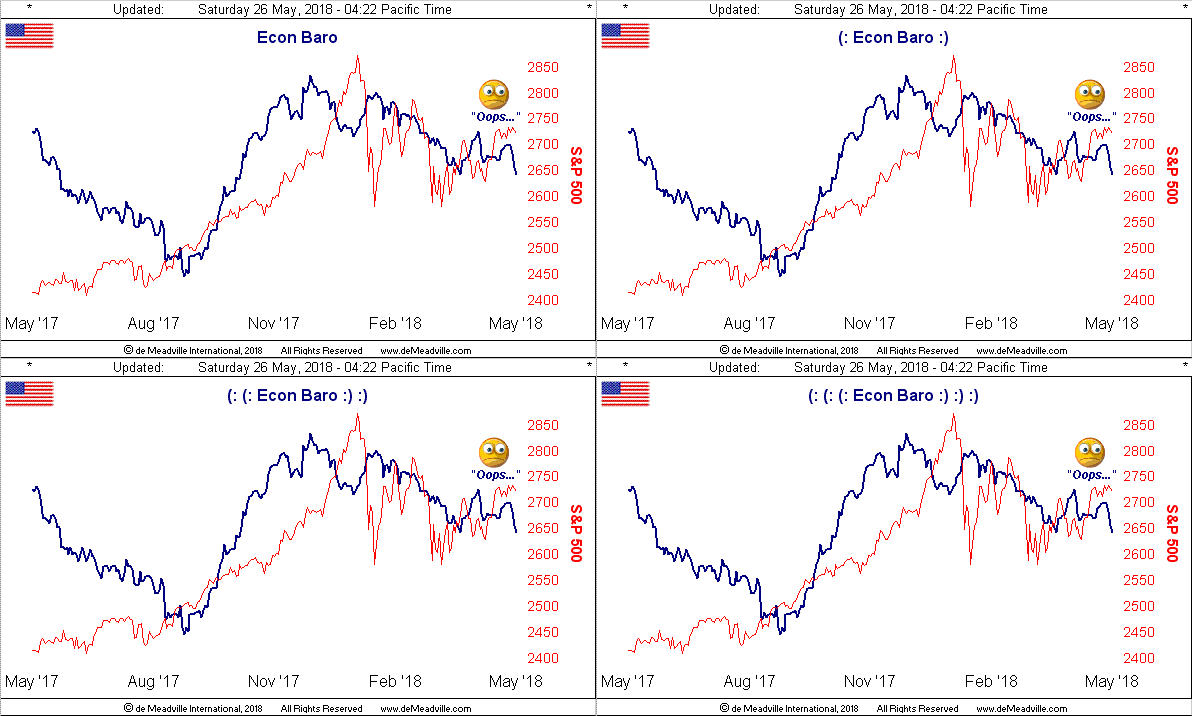
Squire, with all the devices you carry in your peregrinating about, I'm surprised you're not up to speed with the Economic Barometer. (That said, you've something in common with the Fed). 'Twas quite a poor week for the Econ Baro, springtime sales of both New and Existing Homes slowing down, along with Durable Orders negatively reversing. Indeed just a week ago we stated how the Baro's incoming metrics had been "gaining a grip". Oh well...
As for all the talk over Oil, which in a week's time we'll see is still the year-to-date leader of our BEGOS Markets (Bond, Euro/Swiss, Gold/Silver/Copper, Oil, S&P), we wrote in 18 May's Prescient Commentary that "Oil's chart shows it as (still) being at an extreme high 'round +5 points" as measured on our Market Values page: price then was 71.62; now 'tis 67.50. That takes further edge off inflation.
Meanwhile, data this past week from the EuroZone was deemed as "disappointing", highlighted by weaker Purchasing Managers Indices. As well, the Grand Duke of Derivatives (aka "Deutsche Bank (DE:DBKGn)") is eliminating some 7,000 jobs in a "trading retreat": see how much more difficult 'tis when the market doesn't go up all of the time? Oh quit whining over there.
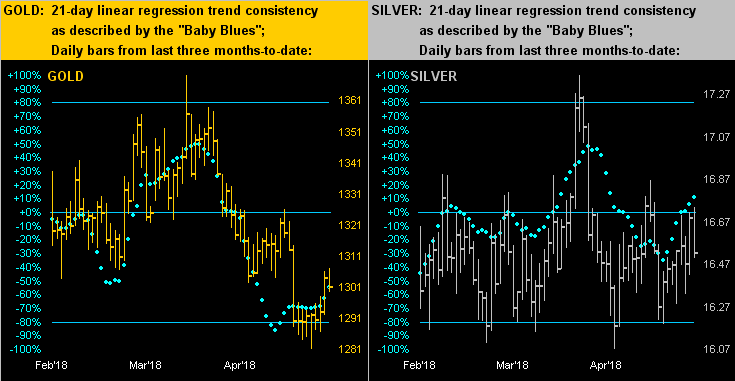
Rather than whine, up is Gold's guideline, at least through these last several days of firming above the major aforementioned support barrier. Note below that for Gold on the left the baby blue dots of linear regression trend consistency are recovering from having gone below their -80% level: generally such rise is suggestive of still higher prices. Firmer still are the Baby Blues for Silver on the right, her price having not recently weakened as much as we've seen for Gold, in testament to the Gold/Silver ratio having been above 80x for a considerable duration by historical standards, (now 'tis 78.8x):
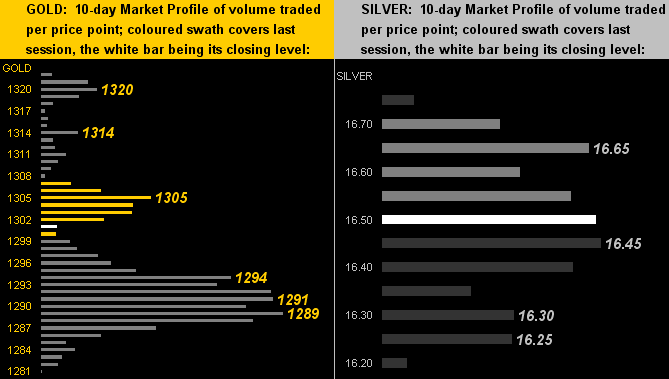
As by the 10-day Market Profiles, Gold (below left) has built in trading support as denoted in the 1294-1289 zone; that for Sister Silver (below right) equates to her 16.30-16.25 shelf:
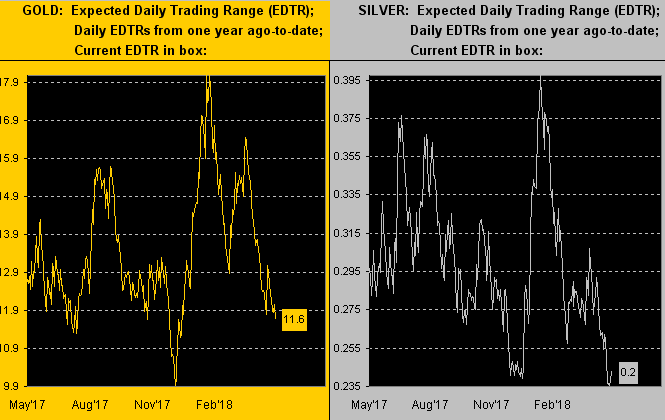
Speaking of trading, the precious metals' EDTRs ("expected daily trading ranges") have been on as narrowing a road as they may go. Below left for Gold, the expected high-low range for the ensuing session reads as just 11.6 points. Below right for Silver, she can't get much narrower than the 0.2 range depicted there:
'Tis narrow too in terms of trading time in the new week given Monday's market closures in both the U.S. and U.K. But for incoming Econ Data for the Econ Baro, 'tis one wide superhighway with 18 metrics coming due, highlighted by job creation in May. The private read from Automatic Data Processing is expected to show slowing jobs growth; the public read from the Department of Labor Statistics is expected to show accelerating jobs growth. Experts one and all, eh? Best to focus one's expertise on Gold!