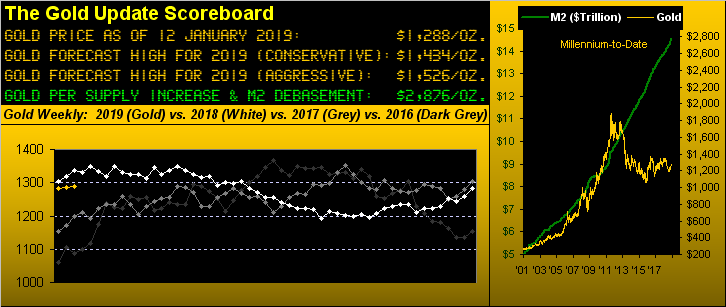
Nearly five years ago came our 24 May 2014 piece entitled "Gold in Neverland" wherein we bemoaned that for "...26 of the last 28 trading days (better than a month), Gold has traded in the 1290s...", its never having been able to materially escape said 10-point zone -- hence the name Neverland -- and its then being nicknamed The Whiny 1290s.
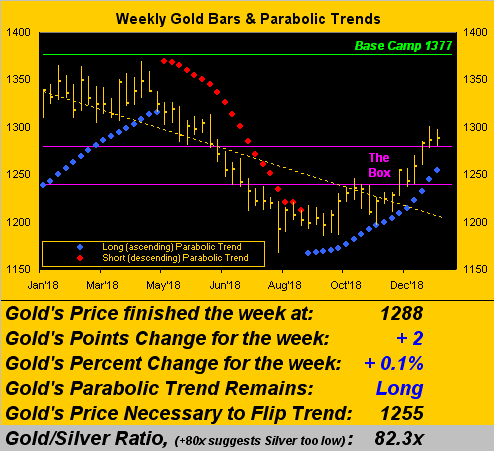
Thus far for 2019 with eight trading days in the books, gold's settle yesterday (Friday) at 1288 finds price up 3 points for the year, just less than one-quarter of one percent. The good news is that gold is at least trading above The Box (1240-1280), albeit still not sufficiently so to morph that 40-point swath from resistance to support. The bad news is that -- save for trading in the 1300s for 16 minutes early in the 04 January session, gold, for the most part, has thus far made its New Year's home back in The Whiny 1290s, indeed having therein traded at some point for all eight days year-to-date. Great. Wake me up when we leave this state.
And the above Gold Scoreboard which always "tells it like it is" --(Howard Cosell) in citing price rather than change puts it stark in our face: Gold's price is above where 'twas at this time both two and three years ago and is below where 'twas one year ago. Nuthin' but status quo. And yet throughout, the driver of debasement -- our M2 money supply -- continues its ascent such that gold by all rights today "ought be" priced at 2876 "...tick...tick...tick...tick...tick..."
To be sure the 3Ds of Debasement, Debt and Derivatives aren't giving back any ground. At an impromptu locker room gathering this past Thursday with a few of our Investors Roundtable members, one whilst lumbering past poised for a moment and with towel in hand adroitly pointed a firm finger at an image on the big screen television of Federal Reserve Bank Chairman Powell and said: "How dare they talk about the debt when they created it!" Brings to mind that Dire Straits lyric from back in '85: "...easy money for nothin'..." But today, $20 trillion in unrepayable debt is sompthin'. Pointing a finger as well is the global head of sovereign ratings over at Fitch, James McCormack, essentially telling the U.S. government to get fully back to work by February's end else, the rating of AAA may lose an A. Okay.
As for gold's return to Neverland, 'tis not altering our conservative forecast high for this year of 1434. Moreover, Jeffrey Currie's gang over at Goldman Sachs (NYSE:GS) is predicting a high only nine points shy of ours at 1425: Goldman being Goldman, they just want to be right first, (although a valued reader wrote in that Goldman being Goldman carries a 50% chance that they'll be wrong). As long as the fees keep a-churnin', eh?
Still with respect to The Whiny 1290s, 'tis the overall 1200 "handle" (trader talk for all prices in the 1200s) that has been a-churnin'. To wit: we've updated the following animated chart of gold's 100-handle closing prices as grouped by the number of days per handle. Last presented as of 18 August 2017, look via the animation at how the 1200 handle days have increased from both then and overall from Gold's All-Time Closing High:
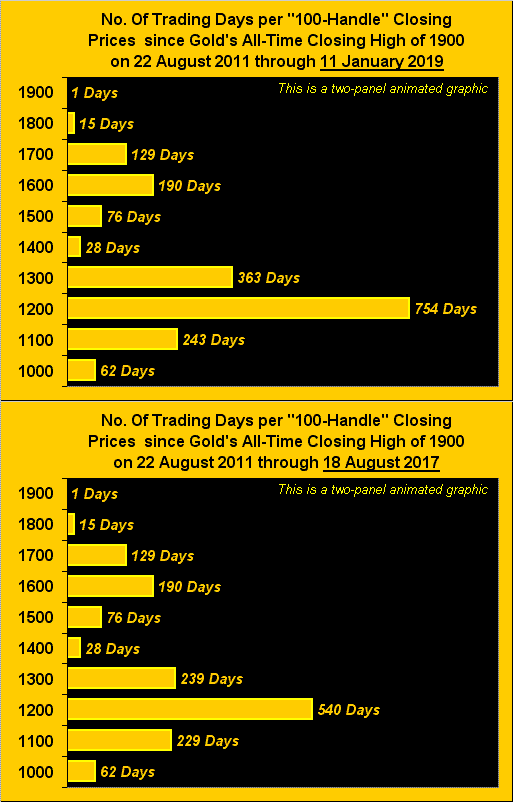
More importantly, we again emphasize how little trading there has been in the 1400 and 1500 handles. That is why we have a conservative forecast for reaching a resistance structure at 1434, but if the price can bust through it, the door then opens to aggressively fly up to the next resistance area at 1526. 'Course, that's all moot if Gold can't first recapture Base Camp 1377 for which the last two material attempts were failures.
As for gold's weekly bars, the parabolic Long trend of ascending blue dots is accelerating higher, the flip point for the Short trend now nearly centered in The Box at 1255. With 18 weeks of duration, this Long trend stands alone as the seventh "longest" millennium-to-date; (the record is 26 weeks). The rightmost bar is referred to by technicians as an "inside week" per its having a higher low and a lower high: such hesitation is a sign of the trend running out of puff. After all, 'tis The Whiny 1290s:
Meanwhile, as we return to the still-declining Economic Barometer -- which was not helped this past week by slowing in the Institute for Supply Management's Services reading for December, nor by the month's Consumer Price Index actually going backward -- we nonetheless therein see a bouncing S&P 500. We're still seeking the full 27% correction for the Index of the mighty 500 stocks ultimately down to 2154 from the 22 September all-time high of 2940, (and as previously noted, reaching thus far as low as 2347 marks 75% of that journey). But as for the bounce, for you Fibonacci Freaks out there, your 62.8% Golden Ratio retracement (off that recent 2347 low) would bring up the Index (presently 2596) to 2713, right about at kitty's mouth:
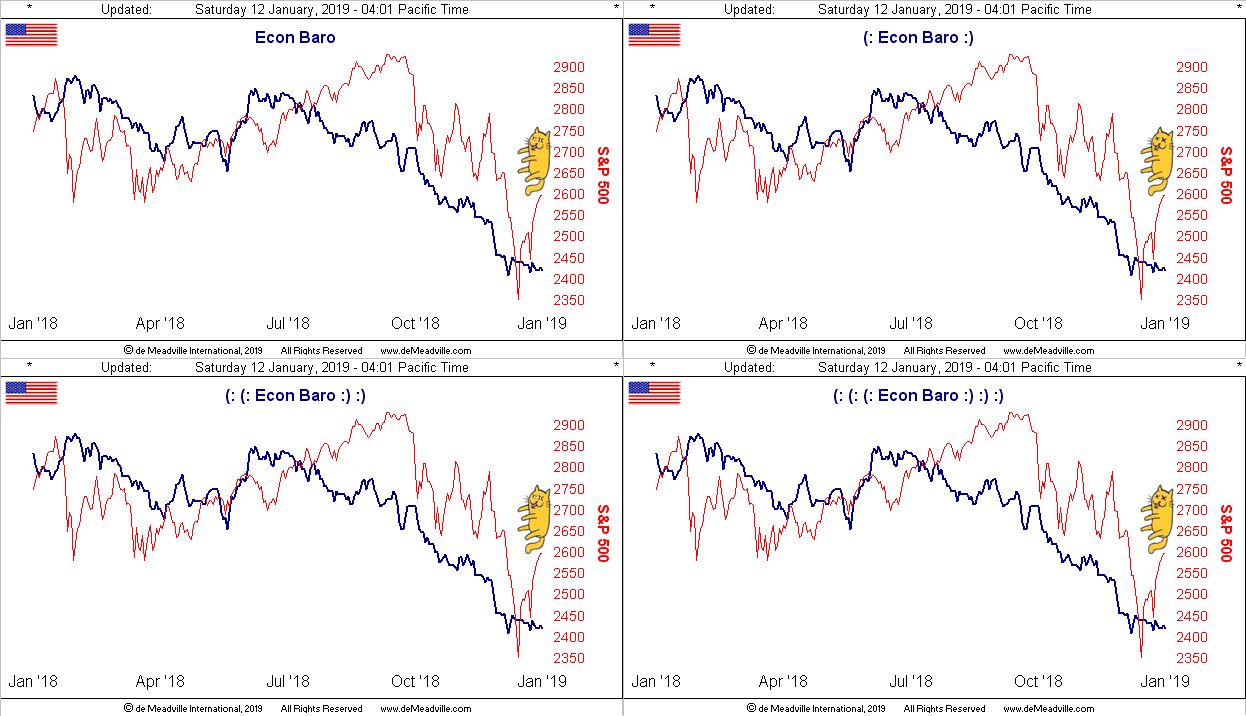
In fact, we put on a wry smile this past week when we heard of the rather antiquated "January Effect" (for rising stock prices) being dragged out of the closet. Back in L.A. during '76, we did enough extensive research on the "January Effect" such that the resulting term paper carried us through three classes, the "get rich quick" scheme amazing students and professors alike. Of course, someone else then published a book on it and the whole thing fizzled. As my dear "founding reader" (J.G.S.) of The Gold Update once quipped: "I don't invest in trading systems because they only work for a while." May the S&P's correction thus continue.
As for the balance of other economies, on the heels of slowing growth for the United Kingdom's Gross Domestic Product, Parliamentarians are on their toes for Tuesday's Big Brexit Vote. Germany's economy shows slowing as well, as China's waning persists. But for those of you at the top, fear not: the automobile analysts in the pits at Bank of America Merrill Lynch (NYSE:BAC) have put Ferrari (NYSE:RACE) on pole position. Order yours today and arrive in style in a week's time at Davos.
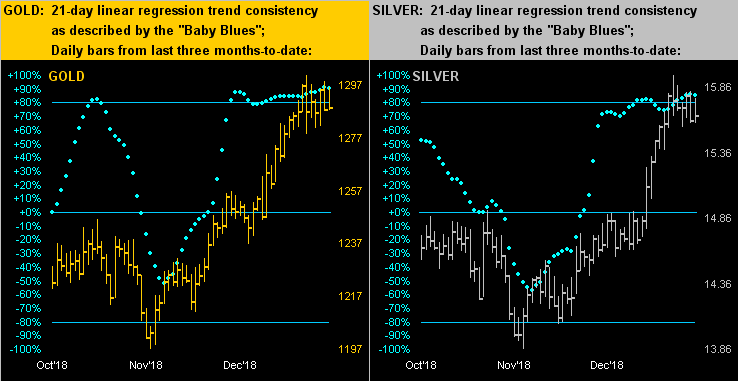
The climb of the precious metals' "Baby Blues" from some two months ago-to-date. Below for both gold on the left and silver on the right their respective blue dot tracks both extended above the +80% axes several weeks ago in thus confirming consistent uptrends, with prices having since further risen. Indeed from gold's low of 1197 two months ago, price's run up to 1300 marks an 8.6% increase and Silver's run from 13.86 up to 15.95 a 15.1% increase. Practically double-the-pleasure with Sister Silver and yet the Gold/Silver ratio today remains at an extremely high reading of 82.3x. As for you Equities Enthusiasts out there, across the same stretch both the VanEck Vectors Gold Miners exchange-traded fund (GDX (NYSE:GDX)) and the Global X Silver Miners (NYSE:SIL) rose 17%. Mind those Baby Blues (you can see 'em updated each day on the website) for should they accelerate near-term below the +80% level, there's really not much built-in structure support for gold down to 1257 nor for silver down to 14.90:
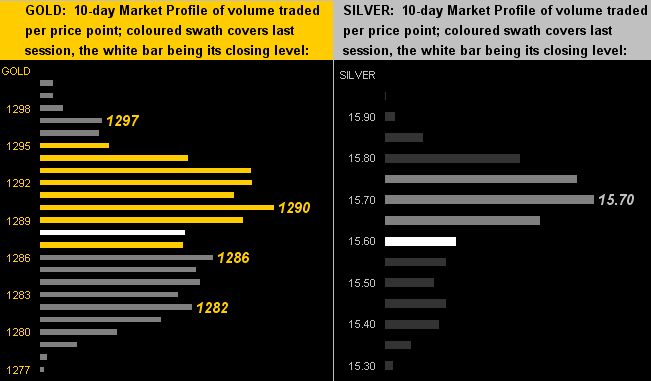
You can see near-term underlying support falling away as well in the 10-day Market Profiles for gold (below left) and silver (below right), prices in both cases having departed from the top of their respective Profiles to now sit just below their most dominate resistors, those being 1290 for the yellow metal and 15.70 for the white metal:
Still, The Whiny 1290s notwithstanding, gold's move up from its November depths has, in turn, placed current price a bit higher in the stack:
The Gold Stack
Gold's Value per Dollar Debasement, (from our opening "Scoreboard"): 2876
Gold’s All-Time High: 1923 (06 September 2011)
The Gateway to 2000: 1900+
Gold’s All-Time Closing High: 1900 (22 August 2011)
The Final Frontier: 1800-1900
The Northern Front: 1750-1800
On Maneuvers: 1579-1750
The Floor: 1466-1579
Le Sous-sol: Sub-1466
Base Camp: 1377
The 1360s Double-Top: (1362 in Sep '17 and 1369 in Apr '18)
2019's High: 1300 (04 January)
10-Session directional range: up to 1300 (from 1277) = +23 points or +1.8%
Neverland: The Whiny 1290s
Trading Resistance: 1290 / 1297
Gold Currently: 1288, (expected daily trading range ["EDTR"]: 12 points)
10-Session “volume-weighted” average price magnet: 1288
Trading Support: 1286 / 1282
2019's Low: 1278 (also on 04 January)
The 300-Day Moving Average: 1272 and rising
The Weekly Parabolic Price to flip Short: 1255
The Box: 1240-1280
Neverland indeed. Recall the title for the 1983 remake of the original 1965 film "Thunderball"?
"It was 'Never Say Never Again', mmb."
Exactly right Squire. And 'it was one of the very few film remakes that used the same fine actor (i.e. Sean Connery) in the starring role. When Gold's price broke above Neverland (The Whiny 1290s) during 2016, we'd hoped that it would be never in Neverland again. We'd again hoped for same during 2017's upside price breakout. And yet again during same in 2018. But in all three material instances price instead came back down below Neverland, each time with the same bad actors (i.e. the "shorts") milling about. Now through these first two weeks of 2019, price again is dawdling about in Neverland. But even with potential near-term price weakness aside, a retake then of Base Camp 1377 followed by the scoot up to our 1434 forecast high and we'll hope for Gold that it will never be in Neverland again!