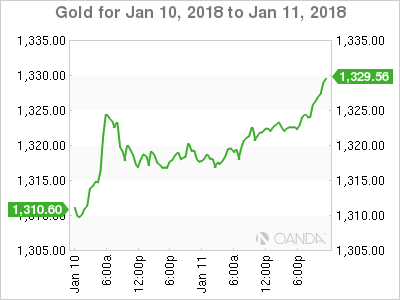
Gold prices continue to point upwards, and the trend has continued in the Thursday session. In North American trade, the spot price for an ounce of gold is $1322.22, up 0.41% on the day. On the release front, PPI and Core PPI both missed their estimates, with declines of 0.01%. On the employment front, unemployment claims jumped to 261 thousand, above the forecast of 246 thousand. On Friday, traders should be prepared for some movement from gold, as the US releases CPI and retail sales reports for December.
Gold has restored some luster in recent weeks, as the base metal has climbed 3.7% percent since December 1. The rally has been all the more impressive, as risk appetite has been high, with the US economy looking strong and the Fed raising interest rates in December. Gold prices often fall when investors are more comfortable with riskier assets, but a weaker US dollar has helped gold post higher – on Wednesday, gold touched a high of $1327, its highest level since mid-September.
The US dollar was broadly lower on Wednesday, and gold took advantage with considerable gains. The catalyst for this move was a report on Wednesday that China was considering slowing or halting the purchase of US government bonds. China boasts the largest currency reserves, estimated at $3 trillion. It is also the biggest holder of US government bonds, in the amount of $1.19 trillion. Why would China make this move? One reason is that it may consider US treasuries less attractive compared to other assets. As well, it could be part of China’s strategy to flex some muscle as a possible trade war looms between the US and China, which are the two largest economies in the world. The report has pushed US Treasury yields higher and sent the US dollar downwards.
XAU/USD Fundamentals
Thursday (January 11)
- 8:30 US PPI. Estimate 0.2%. Actual -0.1%
- 8:30 US Core PPI. Estimate 0.2%. Actual -0.1%
- 8:30 US Unemployment Claims. Estimate 246K. Actual 261K
- Tentative – IBD/TIPP Economic Optimism. Estimate 52.3
- 10:30 US Natural Gas Storage. Estimate -318B. Actual -359B
- 13:01 US 30-year Bond Auction
- 14:00 US Federal Budget Balance. Estimate -34.5B
- 15:30 US FOMC Member William Dudley Speaks
Friday (January 12)
- 8:30 US CPI. Estimate 0.1%
- 8:30 US Core CPI. Estimate 0.2%
- 8:30 US Core Retail Sales. Estimate 0.4%
- 8:30 US Retail Sales. Estimate 0.5%
- 10:00 US Business Inventories. Estimate 0.3%
*All release times are GMT
*Key events are in bold
XAU/USD for Thursday, January 11, 2018

XAU/USD January 11 at 12:30 EST
Open: 1316.77 High: 1323.53 Low: 1315.82 Close: 1322.30
XAU/USD Technical
| S3 | S2 | S1 | R1 | R2 | R3 |
| 1260 | 1285 | 1307 | 1337 | 1375 | 1416 |
- XAU/USD showed little movement in the Asian session. The pair has posted slight gains in the European and North American sessions
- 1307 is providing support
- 1337 is the next resistance line
- Current range: 1307 to 1337
Further levels in both directions:
- Below: 1307, 1285, 1260 and 1240
- Above: 1337, 1375 and 1416
OANDA’s Open Positions Ratio
XAU/USD ratio is showing movement towards short positions. Currently, long positions have a majority (54%), indicative of trader bias towards XAU/USD continuing to move higher.
