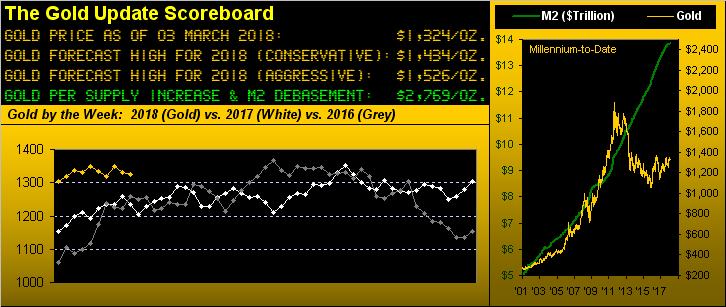
Two trading months plus two days of 2018 already GONE! Yet across the US and 'round into Europe it hardly feels like Spring is about to do so a wit: "snowing here" says a text from the small Mediterranean fishing village of Monaco: put that in yer palm trees.
Neither springing so far this year is Gold. In looking at our above opening Scoreboard, yes Gold is trading at higher levels than 'twas to this point in both of those prior two years. But 2018's price track clearly lacks the spring and upside tilt seen early on in 2017 and 2016. Indeed Gold's having just been poised a mere 10 trading days ago at 1364 to spring up and over the hurdle at Base Camp 1377 instead finds price having settled out the week yesterday (Friday) at 1324, trading en route as low as 1304.
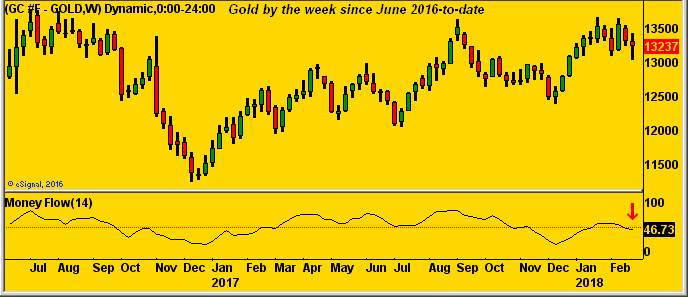
And then there's this annoying technical note: Gold's study of "weekly moneyflow" as we next show has now dipped below the red horizontal line (at 50 on a scale of 100-to-0) in the chart's lower panel. This is only the sixth such downside crossing since September 2014: in all five of those prior downside crossings, price then traveled further south by at least 32 points (a repeat of which would have us visit those "Whiny 1290s"). We'll spare you the average number of points south in those prior cases, as on balance, we view Gold to be in fairly firmer stead these days. Moreover, should Gold stay stout such as to pull the moneyflow study back up above the red line without too much of a price rout, again we'll be settin' our sights on Base Camp 1377:
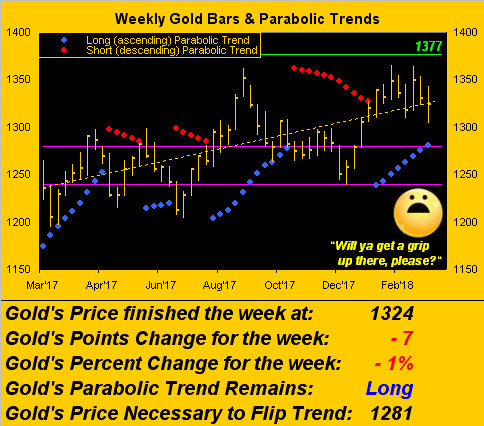
Staying with the weekly bars theme, below we find Gold at 1324 still with some 43 points of clearance above the parabolic flip price of 1281. Yet at present, Gold's "expected weekly trading range" is 31 points, so by that measure there's not a lot of space for downside excursion in the next week or two without flipping the trend from Long to Short. So don't flip: get a grip!
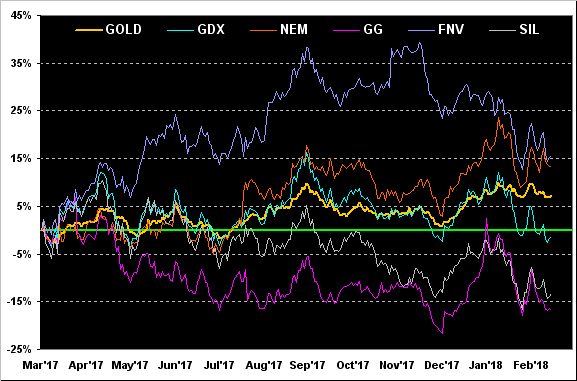
It being month's end plus two days into March, 'tis time to go year-over-year with Gold alongside these precious metals' equities as follows: from best-to-worst we've Franco-Nevada (TO:FNV) +15%, Newmont Mining (NYSE:NEM) +13%, Gold itself +7%, the VanEck Vectors Gold Miners exchange-traded fund (VanEck Vectors Gold Miners (NYSE:GDX)) -1%, the Global X Silver Miners exchange-traded fund (Global X Silver Miners (NYSE:SIL)) -13%, and Goldcorp (NYSE:GG) -17%. The overall picture is somewhat analogous to old Uncle Harry's vital signs monitor clamped onto the head of his hospital bed: "But the lines always do better when Nurse Penelope comes in!" If anyone needs some stimulative nursing out there 'tis Sister Silver: her present denominator price of 16.353 and Gold's numerator of 1323.7 continue to make for an historically high ratio Gold/Silver of 80.1x vs. the millennium-to-date average ratio of 63.0x ...... beep...... beep...... beep......
Either way, through February plus March's first two days, here are the year-to-date standings for the BEGOS Markets, led by the ever-stalwart Swiss franc. 'Tis the de facto go-to-currency amidst uncertainty, be it by the inflation scare, the tariffs dare, the Brexit affair, more debt to bear, and/or by earnings for which there's no real "there" there. Given all these scenarios, Gold ought be far higher, one might swear. But be thee not stuck with the Bond unaware:
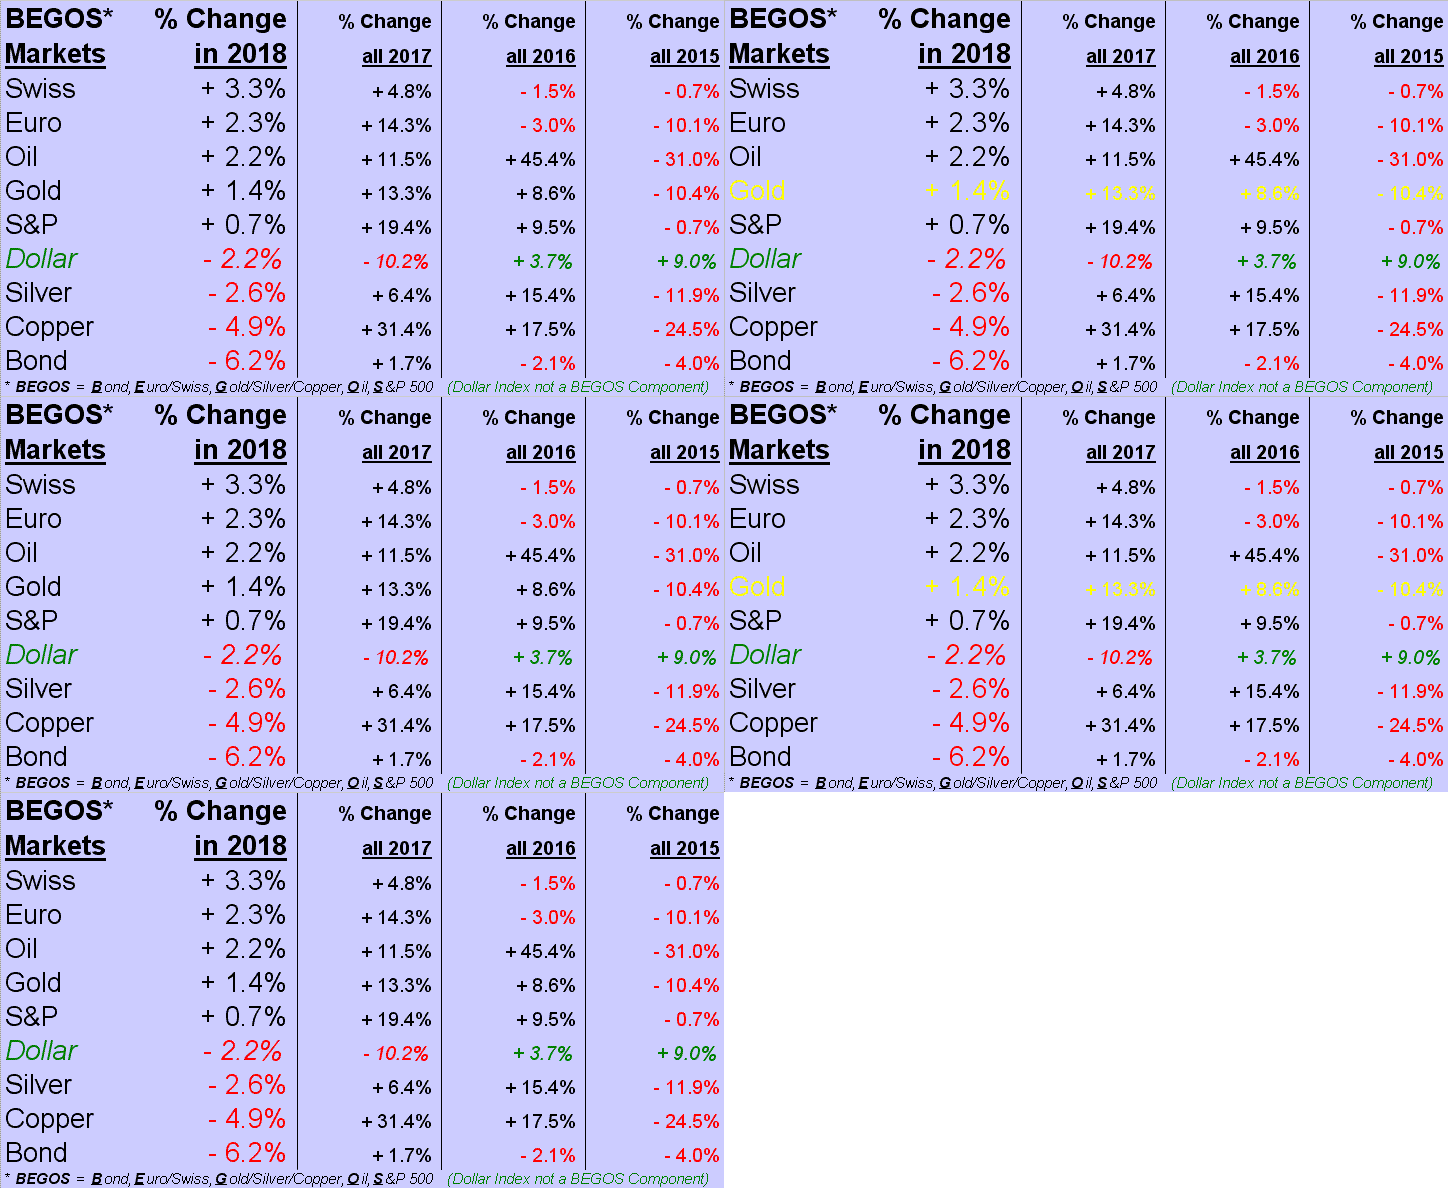
'Course the other real bear, yet to fully emerge from its lair, is the stock market, now not so fair. Take away the Fed's punch bowl, acknowledge the S&P 500's four-year earnings vacuum and we find Ms. Marché to be one angry grizzly. Still barely positive at this point in 2018, the S&P now at 2691 is 6.3% below our precisely-called "Blow-Off Top" of 2872, from which we continue to anticipate a 25% decline down to 2154. Say no more.
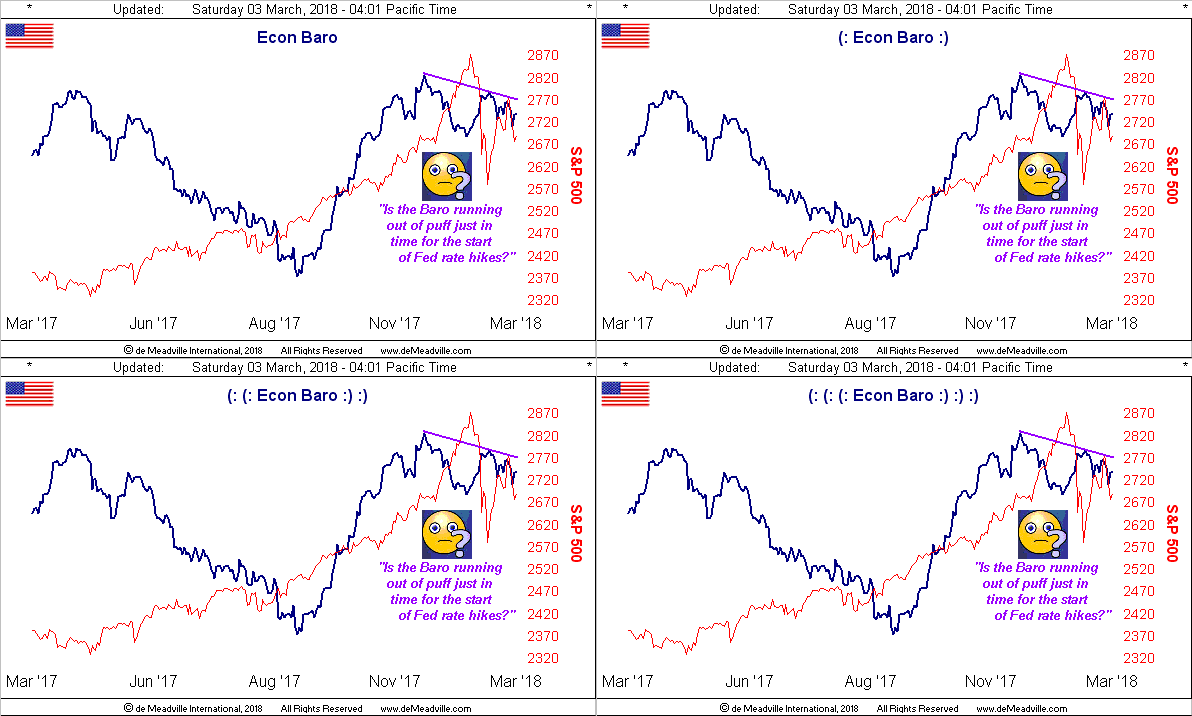
But wait, there is more. Has anyone been following the Economic Barometer? Its recent stint of some slowing didn't garner any mention in Federal Reserve Bank Chairman Jerome Powell's initial tête-à-têtes with the House Financial Services and Senate Banking Committees. And yet this past week brought us reports of a tick slower in Q4 gross domestic product growth, a drop in the Chicago Purchasing Managers Index, no growth in Construction Spending, and declines for both Durable Goods orders and Pending Home Sales. "Always behind the Curve" is oft said of our Fed. Gradual rate hikes for us to dread? Here's the Baro's downside stead:
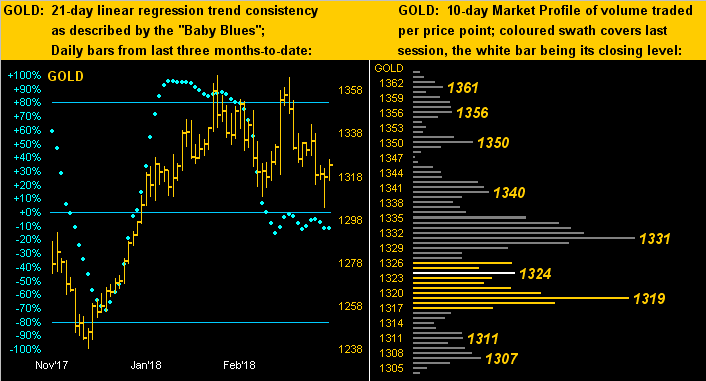
On to the "now" for the precious metals. We start with our two-panel view of Gold, its daily bars for the last three months-to-date on the left and 10-day Market Profile on the right. And therein at left the good news continues for the "Baby Blues", the measure of 21-day linear regression trend consistency still refusing to give in to the downside. Contra to the weekly moneyflow line breaching its red 50-level (as depicted near the top of this missive), the stabilizing we see here of the blues dots 'round their 0% axis defines the 21-day trend more as "trendless" rather than down. Meanwhile at right we see the dominant trading prices of 1331 as resistance and 1319 as support, a range too tight to hold in reality:
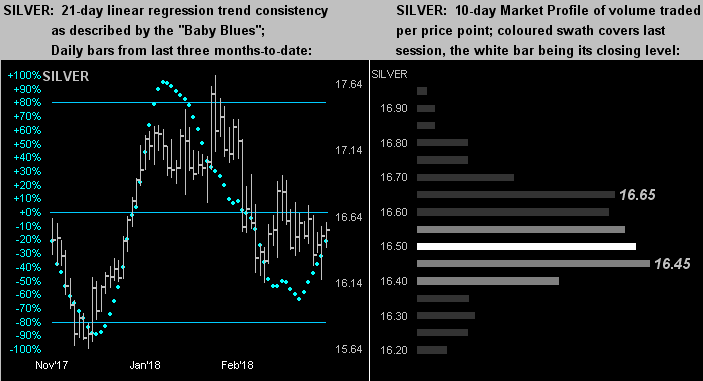
Meanwhile for Sister Silver, her "Baby Blues" (below left) are still recovering from their recent low, which as noted a week ago didn't extend down to the -80% line, suggestive that the recent selling does not contain much commitment. And in her Profile (below right) we see similar to that for Gold a too-tight trading range between the resistor at 16.65 and supporter at 16.45:
Finally with the turn of the monthly calendar page, here is the Gold Structure graphic with its defined pricing layers. The rightmost wee candle represents the first two trading days of March. Our red friend down there remains on the wrong side of the trade, indeed in the wrong product. Someone's got to lose:
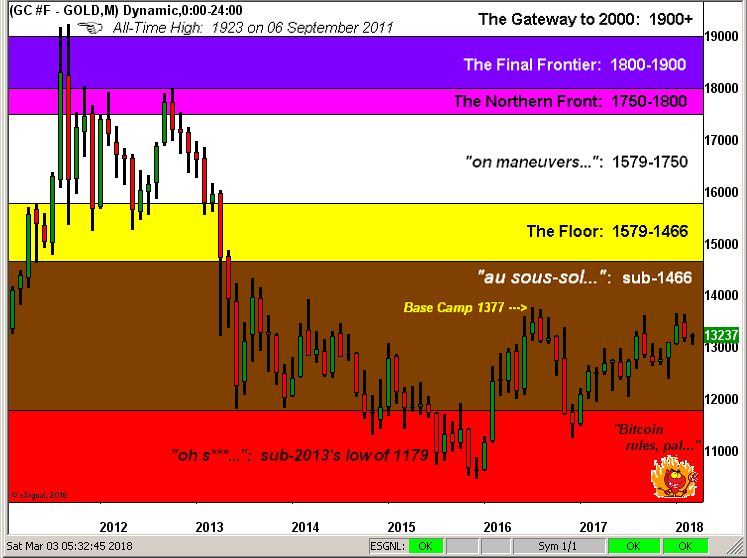
Indeed February is already GONE! But clearly not the chill of winter. One wonders if the infamous Newsweek piece from 28 April 1975 entitled "The Cooling World" is finally being vindicated after some 43 years. We trust that same shan't extend into the price of Gold, the market forces for which still have it trading at but half its currency debasement value. So burn up the Buck and let's warm this yellow metal UP!