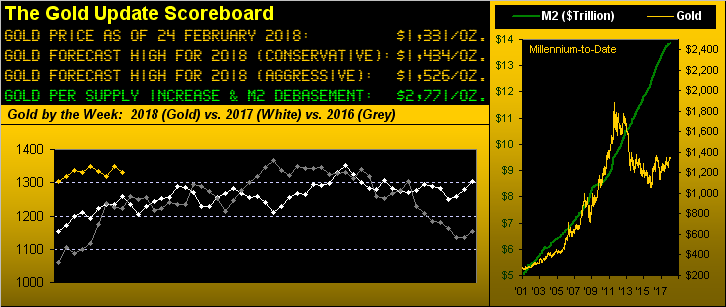
Long-time readers of The Gold Update know that our microphones are just about everywhere as we return to those placed inside the Salzburg clinical offices of esteemed analyst in the psychosis of precious metals, Dr. Youara Nichtsogut...
Dr. Nichtsogut: "Ahhh, Sister Silver, such the honourable surprise is this! Your good man Gold was here October last, suffering from CEUD."
Silver, (preferring to stand rather than lie upon the couch): "CEUD, Doc?"
Dr. Nichtsogut: "Chronic Extreme Undervalaution Depression. I suppose this, too, is why you are here?"
Silver: "You can nix the fancy lingo, Doc. I've fallen off the radar and am forever wearing this industrial metal jacket. Day after bleedin' day I watch Gold being priced at better than 80 times myself, while I can't even find my way out of the 16s. I've come close to having to hock my precious metal pinstripes just to survive. I tell ya, Doc, I get no respect."
Dr. Nichtsogut: "Oh you like Dangerfield, do you? We once had a patient..."
Silver (interrupting): "Cut the crap, Doc. I'm being viewed as danger instead of being outstanding in my field."
Dr. Nichtsogut: "Ok, Sister. Let's look at your chart...
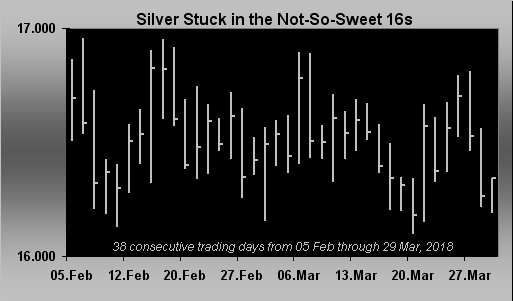
...ya, ya, ya, your problem is obvious: 38 days of SPE ... uh, that's Single Price Entrapment. Our records indicate that you last had a 53-day run of SPE during 2005 when you were stuck in the 7s. The good news of course is that you're better than twice as high that level today here in the 16s!"
Silver: "Yeah, that's cute, Doc, but I was seven times as high at 49 back in 2011."
Dr. Nichtsogut: "And so again shall you be, my dear. Just stay positive. Now, our time being up, that will be two 1893 Morgan Dollars, please..."
Silver: "In yer dreams, Doc!" (leaves in a huff, slamming door)
Dr. Nichtsogut: "She always was a head-strong child..."
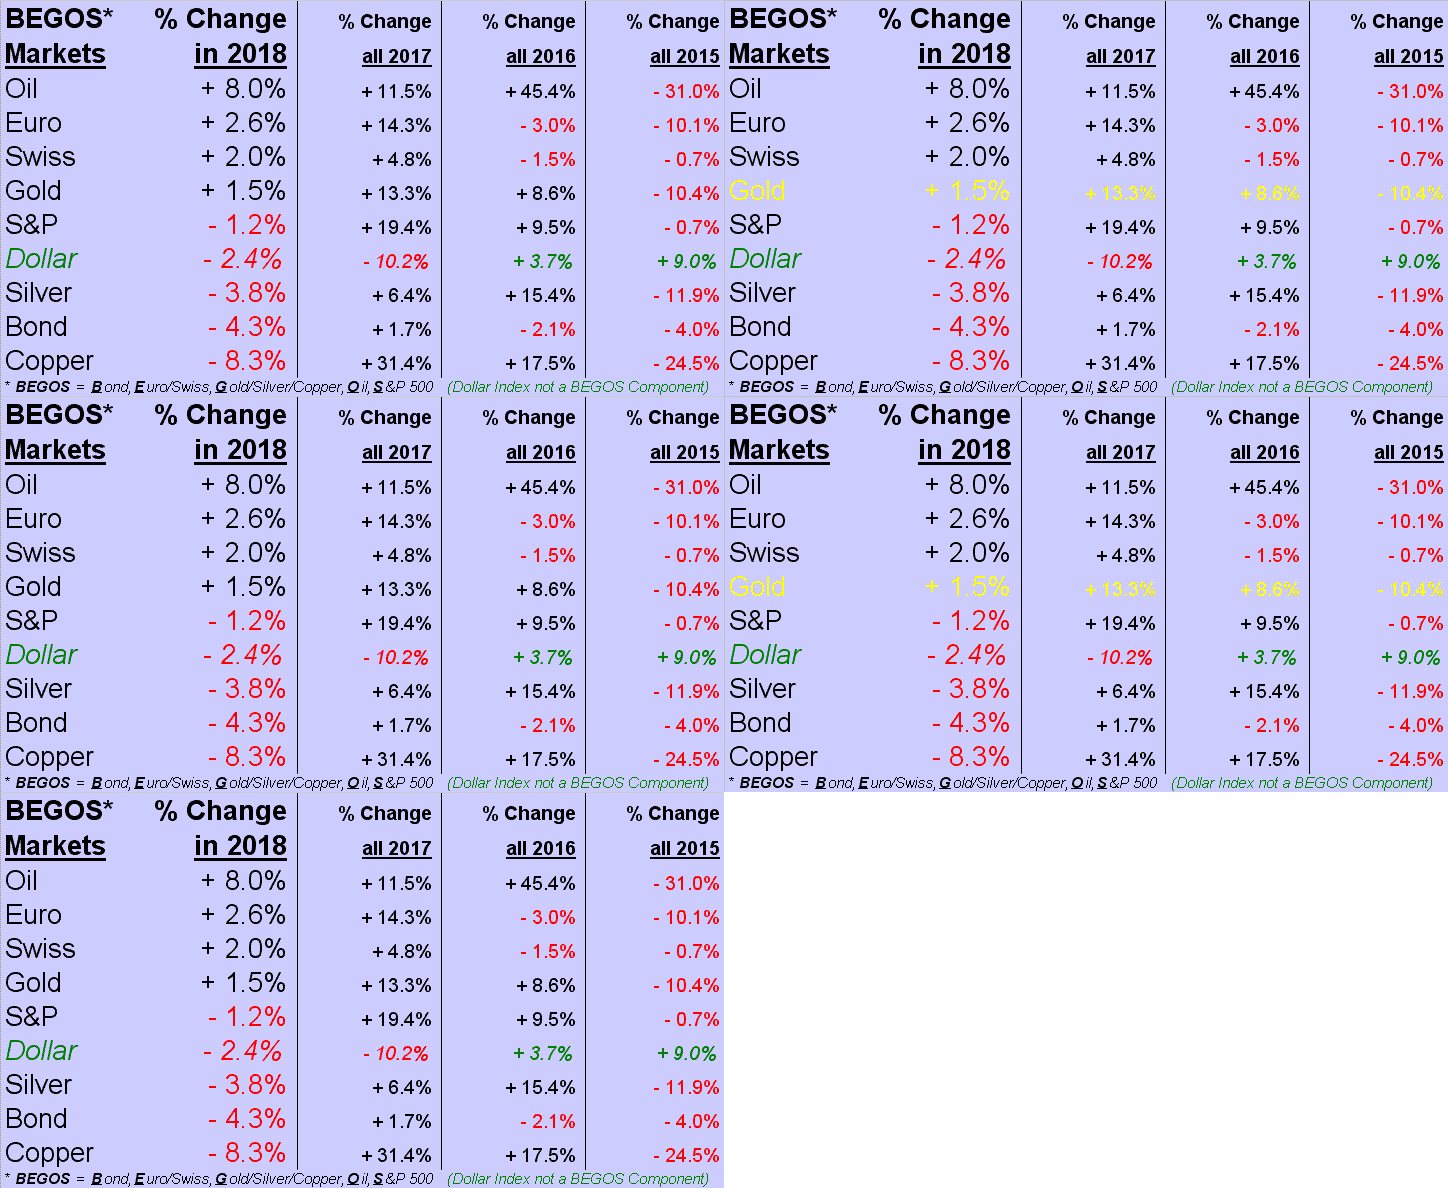
But to be sure, lacking comparative strength through Q1 in 2018 are the precious metals. Gold year-to-date is barely above water at +1.5%, after Q1 performances in 2017 and 2016 respectively of +8.6% and +16.3%. As for "stuck in the 16s" and "still seeking respect" Sister Silver, she's -3.8% through Q1, her prior three Q1 readings (2017-2015) having been +14.5%, +11.6% and +6.0%. Here's how all the BEGOS Markets now stand, with Oil at the top and Copper the big flop:
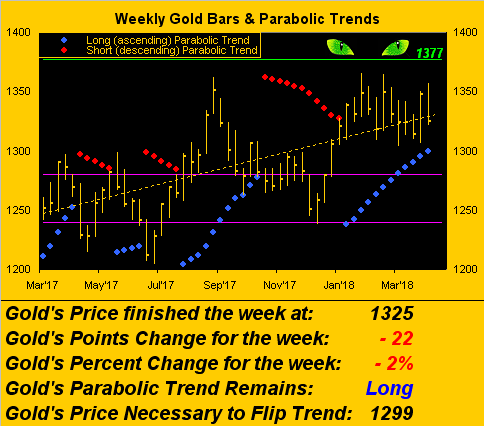
Still through it all, we find Gold's weekly parabolic trend still in ascent, but price now just 26 points above the 1299 "flip to short" level, this past shortened trading week having settled out Thursday for the yellow metal at 1325. Gold's expected daily trading range is 15 points whilst that for the weekly is 32 points, a sufficient enough distance to put us on "flip watch". Mind thereto the year's low -- 1304 -- for should it go, the Long trend likely gets the heave-ho. Regardless as the year unfolds, our eyes remain on the initial prize up there at Base Camp 1377:
It being month's end, indeed quarter's end, from this time a year ago-to-date here next is Gold along with several of the prime precious metals equities brethren. From best performance track to worst we've Newmont Mining (NYSE:NEM) +18%, Gold itself +6%, Franco-Nevada Corporation (TO:FNV) +4%, the VanEck Vectors Gold Miners exchange-traded fund (GDX (NYSE:GDX)) -4%, Goldcorp Inc (NYSE:GG) -7%, and the Global X Silver Miners "Gettin' no respect!" exchange-traded fund (Global X Silver Miners (NYSE:SIL)) -14%.
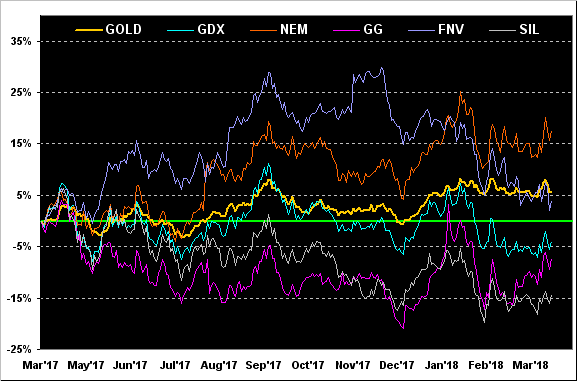
Yes that's correct: even languishing SIL is underperforming laggard GG. And not to overly harp on the Gold/Silver ratio (presently 81x, and as detailed in our 04 February piece "Gold-Silver Ratio Tops 80x - What Happens Next?"), but stints above 80x exceeding five days are extremely rare, the longest one this millennium being 18 days just in this past February and the present one now 12 days in length. There was one that reached 17 days during 2016, one of five days in 2009, and prior to that, one of six days in 2003. Be on alert either for Gold to tank without Silver suffering (improbable), else for Silver more likely to play catch-up. Remember: given the millennium-to-date average Gold/Silver ratio is 63x, a return to that with Gold flat puts Silver at 21 ... write it down.
Speaking of down, so remains the track of the Economic Barometer. How's that Q1 gross domestic product growth of +2.9% workin' out for ya? Or that record $92 billion StateSide increase in credit card debt last year? That's greater than a full month's dosage of $80 billion back during QE purchases -- and the outstanding balance of such costly debt now exceeding $1 trillion is more than a year's dosage of QE purchases. Creepeth ever lower, our Baro. Shan't be on television; but 'tis here:
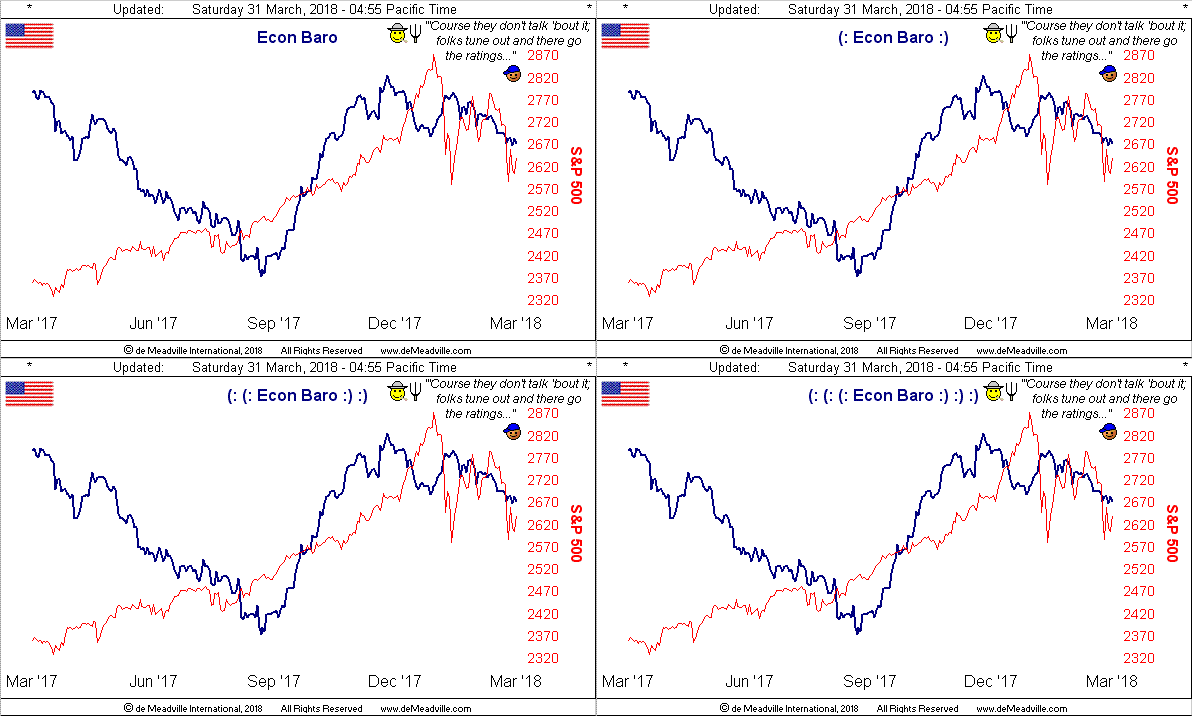
As for the S&P 500 (red line), now at 2641 'tis -8% from its 2872 all-time high: so -17% more to go shall bring us -25% to 2154 in toto, (just in case yer frettin' at home over yer faux dough).
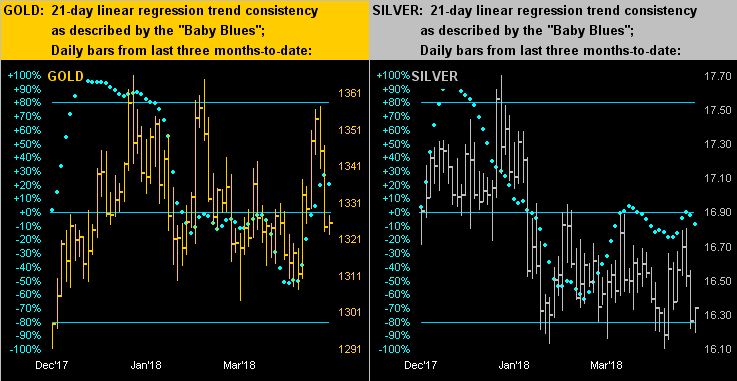
Fretted as well we find below the three month daily bars for both Gold on the left and Silver on the right. Just as a week ago were we encouraged by the baby blues dots of regression trend consistency appearing buoyed for further upside, now they've kinked lower as if kicked in the backside. Still, barring both markets' recent lows getting blown, 'tis fairly range-bound stuff to us:
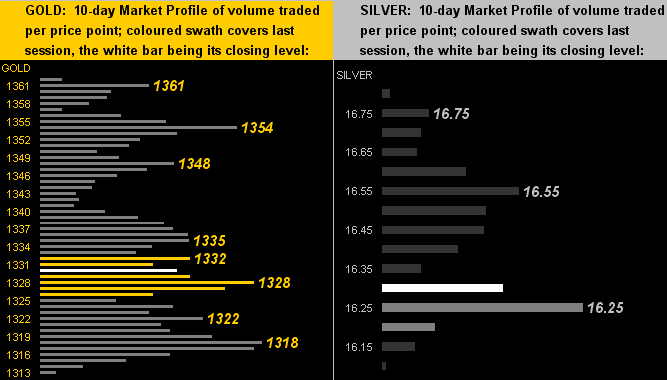
As for the 10-day Market Profiles, Gold (below left) has fallen back into its thicket of supporters as depicted, whilst Sister Silver (below right) tested hers at 16.25, indeed finishing the week on Thursday at her high trade for that day ... encouraging perhaps, but given price at just 16.340, hardly are we impressed:
So with both the month and quarter (sounds like a pub) in the books, to Gold's structure chart we go with its defined pricing zones. Again, the nearest pronounced highlight therein per the arrow remains Base Camp 1377: "So close ... and yet so far", --(Hervé Villechaize as 'Nick Nack', "The Man with the Golden Gun", Eon Productions, '74). Get up through 1377 and then we'll focus on some real Golden Fun:
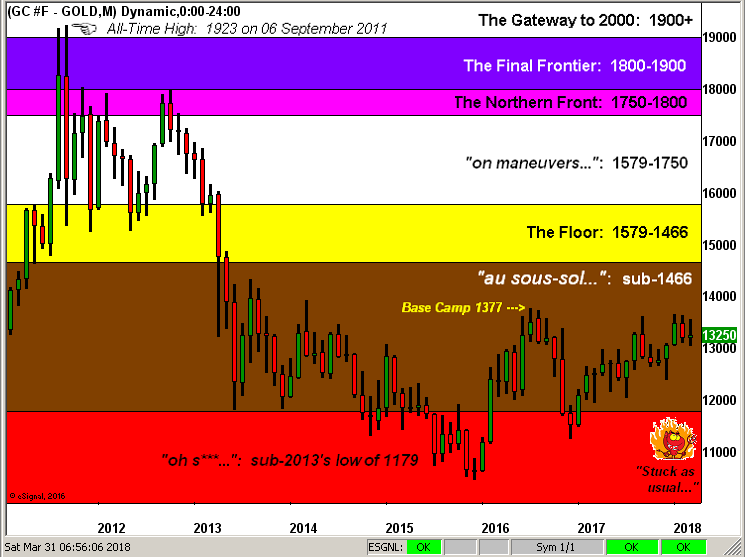
In closing, we read that Wall Street's account-fleecing fee churners found their average bonus increase by 17% in 2017 to $184,000, excluding of course pay along the way. Said bonus alone is nearly four times the annual $45,000 in wages generated by the average working American schlub out there. As for said schlub's stocks, likely for whom half have not, one wonders to what extent one benefited from the year's 19% increase in the S&P 500 -- and that's before fees -- which as well are collected in stride on the downside. More reason still to join the Gold ride!