

Legendary global investor John Templeton once said that the best time to buy was when there was “maximum pessimism,” and the best time to sell was when there was “maximum optimism.”
This type of contrarian investing takes great conviction and nerves of steel, but its practitioners—Templeton included—can be rewarded handsomely. The trick is to find the opportunities.
Right now I see gold as the ultimate contrarian investment. The yellow metal is largely unloved at the moment. It’s set to notch its worst monthly slump since November 2016, and the 50-day moving average is threatening to fall below the 200-day moving average.
Bloomberg reports that the S&P 500-to-gold ratio is nearing its highest level in over 15 years. As of this week, it takes close to two and a half ounces of gold to buy one “share” of the S&P 500. That’s up significantly from September 2011 when two-thirds of an ounce of gold was enough to get you entry. 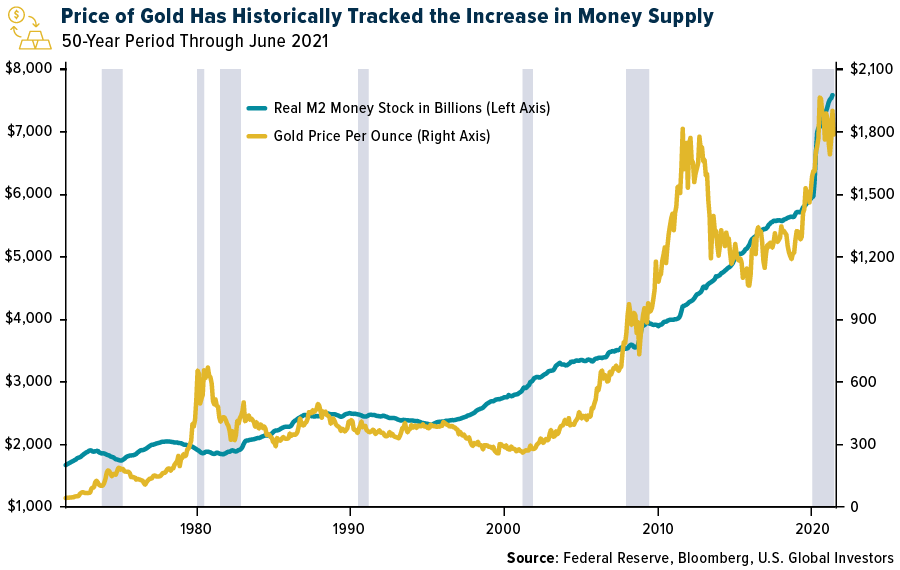
All of this points to the fact that gold is extremely undervalued right now, and no one seems to be paying much attention. I don’t know if this means we’re at “maximum pessimism.” What I do know is that all of the traditional drivers of the gold price are firmly in place, making the yellow metal very attractive, I believe. I’ll highlight two of those drivers below.
Record Money-Printing Favors Gold
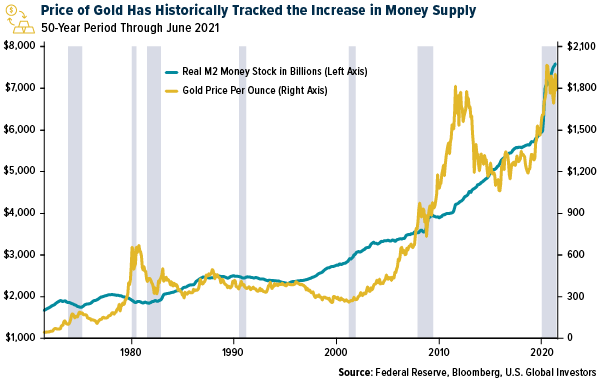
Over the past 18 months, central banks have taken unprecedented measures to prop up their economies. That includes printing money at a record pace, which has the direct effect of diluting the purchasing power of the local currency.
Recently I shared with you that nearly a quarter of all U.S. dollars in circulation has been created since January 2020. What that means, essentially, is that the greenback has lost a quarter of its value thanks to the actions of Powell & Company.
Such money-printing has rightfully triggered massive interest in Bitcoin, which (unlike the dollar) is completely decentralized and has no third-party risk. The rate of new Bitcoin issuance is cut in half roughly every four years. No central banker, then, can push a button and create millions more Bitcoin out of thin air.
The same can be said of physical gold. Gold’s supply growth is naturally restricted by a lack of new large discoveries and companies’ reluctance to spend more to develop harder-to-mine deposits.
One advantage that gold has over Bitcoin is that there’s decades’ worth of data illustrating the near-perfect positive correlation between the amount of money circulating in the U.S. economy and the price of gold. As the value of the U.S. dollar has decreased due to greater rates of money-printing, gold has surged to new record highs.
The implication, of course, is that gold may continue to benefit from the Fed’s easy-money policies.
Inflation to Remain Elevated
The second factor is something I’ve been writing a lot about lately—inflation. May’s consumer price index rose 5% over the same month last year. That’s the highest rate we’ve seen since August 2008.
The real inflation, though, could be much higher. The price of used cars and trucks are up more than 36% from last year, according to vehicle auction company Manheim, with some pre-owned vehicles selling for more than their original sticker price.
Or consider home prices. They climbed at their fastest rate on record in April, increasing 14.5% year-over-year, surpassing the previous record rate set in September 2005.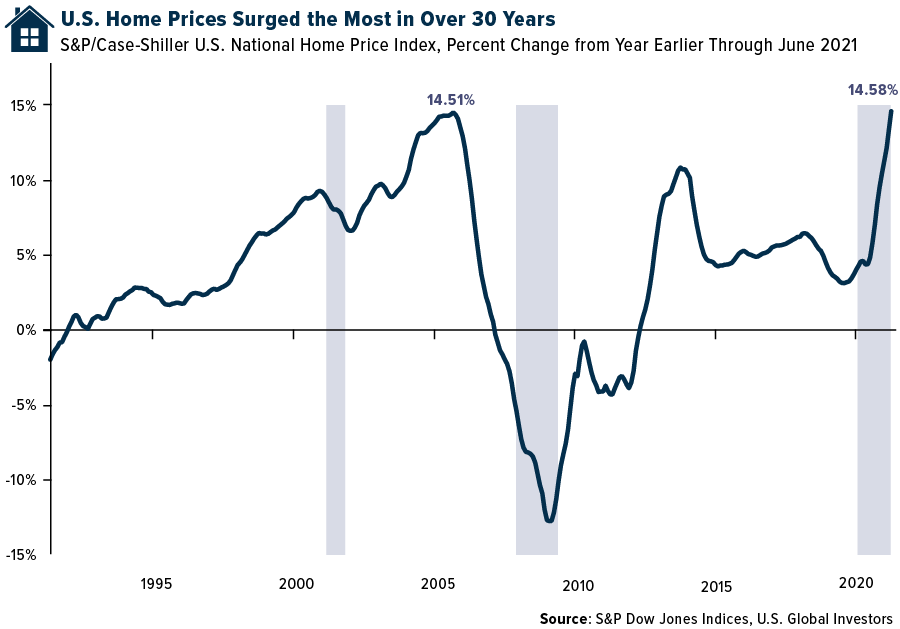
Despite the Fed’s insistence that this current spate of inflation is “transitory,” analysts at Bank of America believe prices could remain elevated for two to four years. Short of a major financial crisis, central banks are unlikely to raise rates in the next six months to tame inflation, according to the bank. The CME Group’s FedWatch Tool shows there’s a 100% chance of rates staying near zero until at least the end of 2021.
Everyone’s heard at one point or another that gold is an excellent inflation hedge. That hasn’t been true in every cycle, and it’s not true now: The CPI is up 5%, while gold is effectively flat compared to a year ago.
But that may be because we’re at “maximum pessimism,” as Templeton called it. Gold is presently out of favor as stocks chart new all-time highs. If Templeton were alive today, he might say now is the time to buy.
Plus, with bond yields trading below zero on a real basis right now, investors may have little alternative than to consider gold and gold mining stocks in an effort to combat inflation’s impact on their portfolios.
All opinions expressed and data provided are subject to change without notice. Some of these opinions may not be appropriate to every investor. By clicking the link(s) above, you will be directed to a third-party website(s). U.S. Global Investors does not endorse all information supplied by this/these website(s) and is not responsible for its/their content.
The Consumer Price Index (CPI) is a measure of the average change overtime in the prices paid by urban consumers for a market basket of consumer goods and services. M2 is a measure of the U.S. money stock that includes M1 (currency and coins held by the non-bank public, checkable deposits, and travelers' checks) plus savings deposits (including money market deposit accounts), small time deposits under $100,000, and shares in retail money market mutual funds. The S&P 500 is a stock market index that tracks the stocks of 500 large-cap U.S. companies. The S&P CoreLogic Case-Shiller U.S. National Home Price NSA Index is a composite of single-family home price indices for the nine U.S. Census divisions and is calculated monthly. It is included in the S&P CoreLogic Case-Shiller Home Price Index Series which seeks to measure changes in the total value of all existing single-family housing stock.