Get 40% Off
👀 👁 🧿 All eyes on Biogen, up +4,56% after posting earnings. Our AI picked it in March 2024.
Which stocks will surge next?
Unlock AI-picked Stocks

Gold Is Doing Its Best

Published 03/25/2021, 10:38 AM
Updated 07/09/2023, 06:31 AM

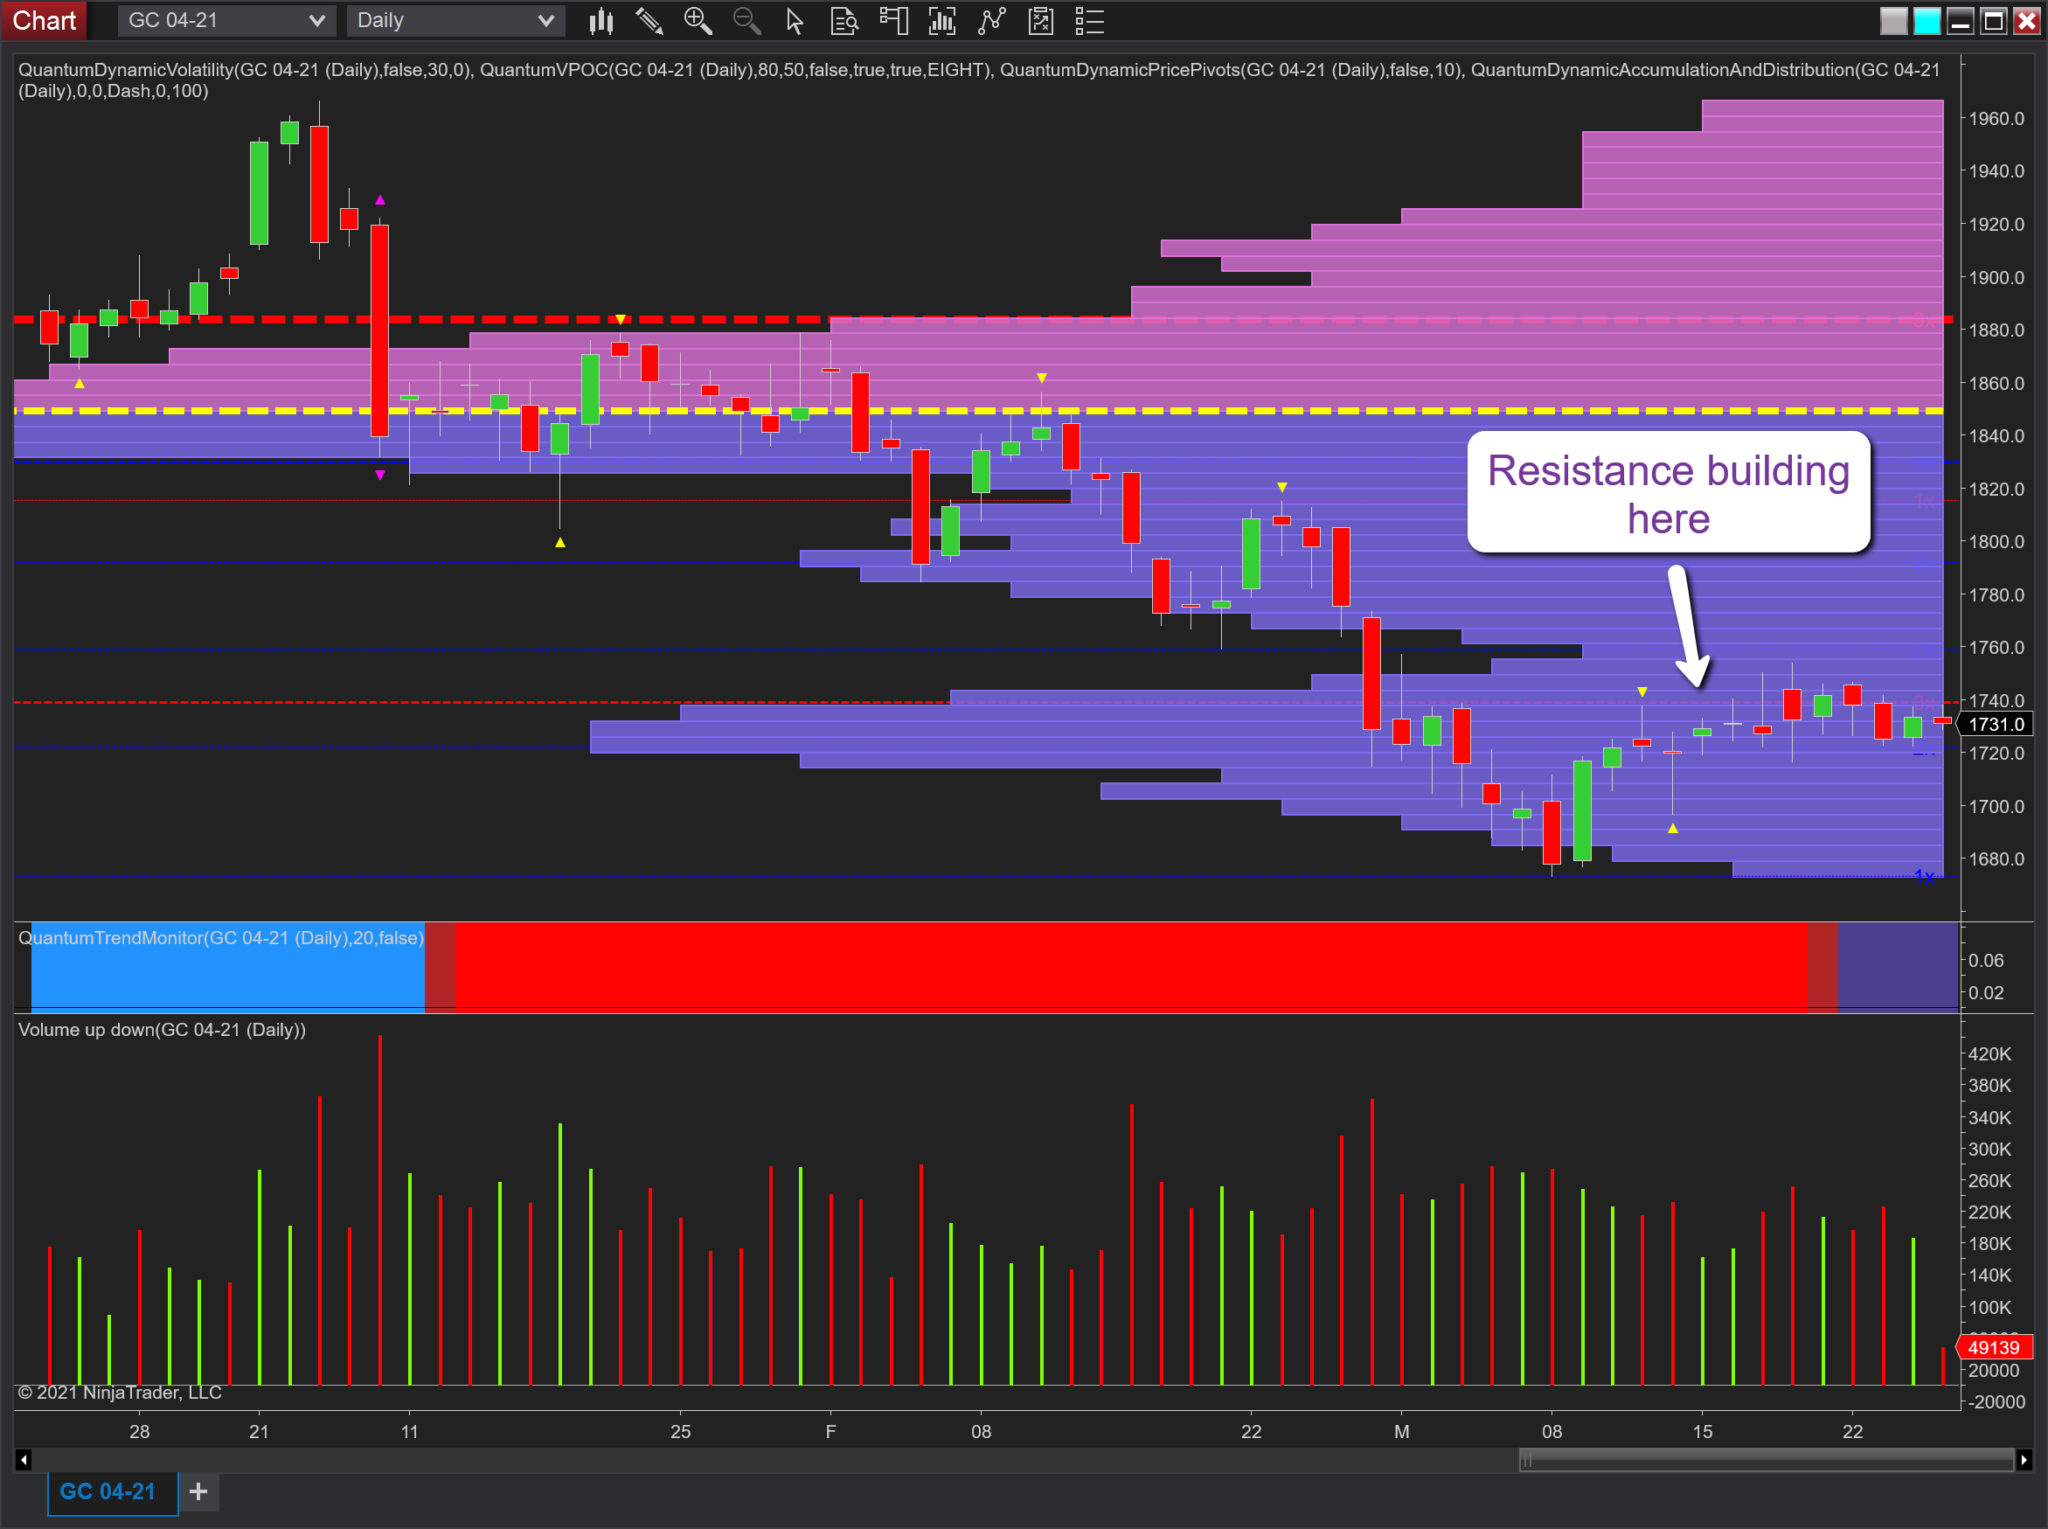
Gold Daily Chart.

Gold is doing its best to battle back, but finding it a real struggle on the daily chart. With a congestion phase now developing, some important levels of resistance are building as a result. As I’ve outlined in previous posts, we have seen many attempts to rally over the last few months, but all have been snuffed out rapidly as bearish sentiment continues to remain dominant. However, on this occasion, we have seen the rally off the $1,680-per-ounce price point. It is one that continues to hold well above $1,700 per ounce, as the metal trades at $1,728 per ounce at the time of writing.

What is also interesting is the transition of the trend monitor from dark red to dark blue, thereby, sending a signal of a possible reversal ahead. In other words, as Wyckoff would have explained, from a primary trend lower to a primary trend higher. We will see in due course, and no doubt it will be helped by talk of inflation.

Returning to the technical picture: First, we have a strong level of resistance building, as can be seen by the red dashed line of the accumulation and distribution indicator at the $1,74-per-ounce level. This was tested yesterday and again this morning and, hence, is significant. It is one that will need to be breached if any bullish sentiment is to build longer term. And should this level be breached on good volume, this resistance will then become support and provide a strong platform for any recovery. The good news is that ahead we have a low volume node at $1,760 per ounce and, therefore, we can expect to see the price action move through here with ease before it hits further volume-based resistance around the $1,800-per-ounce level.
3rd party Ad. Not an offer or recommendation by Investing.com. See disclosure here or remove ads .

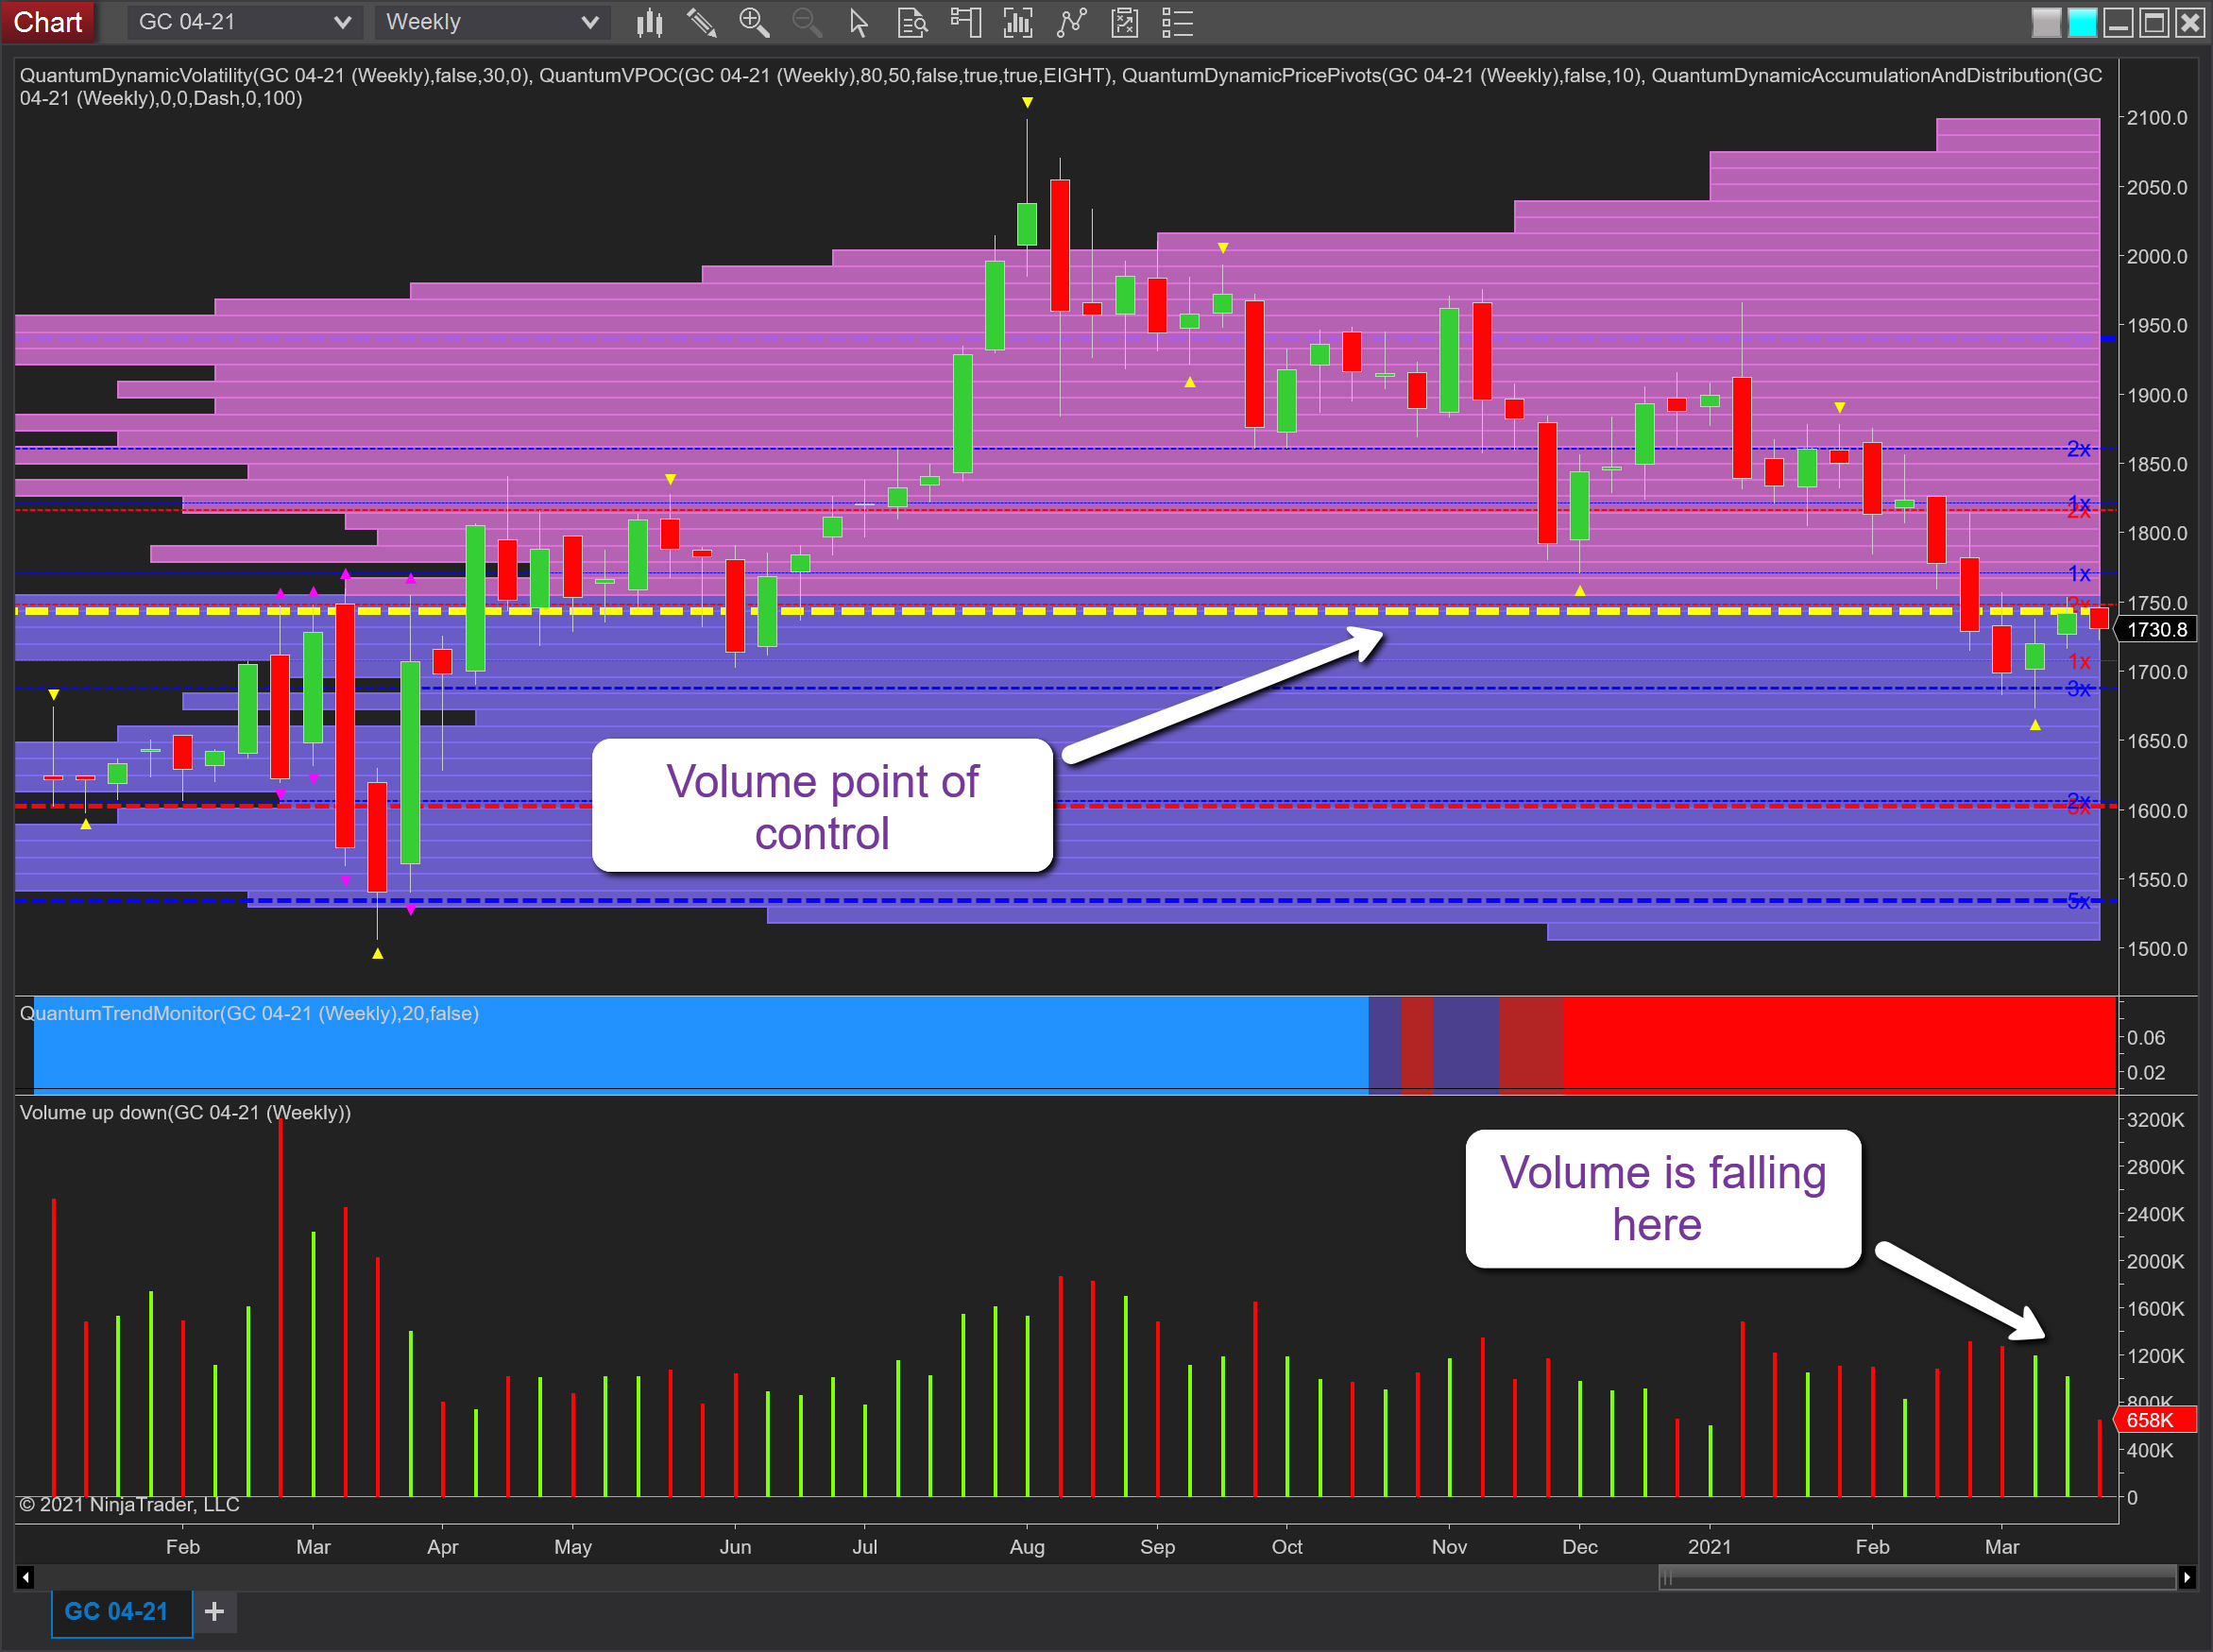
Gold Weekly Chart.

If we move to the weekly chart, the reason for this congestion period is instantly clear, as we have the VPOC itself denoted with the yellow dashed line at $1,740 per ounce. So expect to see the current congestion phase continue for a while. Note also on this chart the fall in volume over the last two weeks. So an attempt to rally on volume, which is declining, is not a sign of strength. So I expect to see further congestion, as we saw in the mid part of last year before any meaningful move higher.

Latest comments

so gold is bottomed ?
never underestimate gold!  I've seen this thing around the $ 1450's
really enlightening, thanks ma'am
Thid wonderful lady is of the best analysts I' ve ever seen. She is usually right and quite moderated to express without bias what's coming in gold's market.
Anna coulling what you expected about gold I think lower trend start low maximum 1600
Risk Disclosure: Trading in financial instruments and/or cryptocurrencies involves high risks including the risk of losing some, or all, of your investment amount, and may not be suitable for all investors. Prices of cryptocurrencies are extremely volatile and may be affected by external factors such as financial, regulatory or political events. Trading on margin increases the financial risks.
Before deciding to trade in financial instrument or cryptocurrencies you should be fully informed of the risks and costs associated with trading the financial markets, carefully consider your investment objectives, level of experience, and risk appetite, and seek professional advice where needed.
Fusion Media would like to remind you that the data contained in this website is not necessarily real-time nor accurate. The data and prices on the website are not necessarily provided by any market or exchange, but may be provided by market makers, and so prices may not be accurate and may differ from the actual price at any given market, meaning prices are indicative and not appropriate for trading purposes. Fusion Media and any provider of the data contained in this website will not accept liability for any loss or damage as a result of your trading, or your reliance on the information contained within this website.
It is prohibited to use, store, reproduce, display, modify, transmit or distribute the data contained in this website without the explicit prior written permission of Fusion Media and/or the data provider. All intellectual property rights are reserved by the providers and/or the exchange providing the data contained in this website.
Fusion Media may be compensated by the advertisers that appear on the website, based on your interaction with the advertisements or advertisers.
© 2007-2024 - Fusion Media Limited. All Rights Reserved.