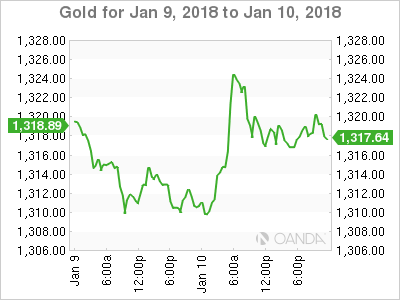
Gold has posted gains in the Wednesday session. In North American trade, the spot price for an ounce of gold is $1316.80, up 0.30% on the day. On the release front, it was a quiet day. Import Prices slowed to 0.1%, short of the estimate of 0.4%. On Thursday, the US releases PPI reports and unemployment claims.
The US dollar is under pressure on Wednesday, and gold has moved higher. The catalyst for this move was a report on Wednesday that China was considering slowing or halting the purchase of US government bonds. China boasts the largest currency reserves, estimated at $3 trillion. It is also the biggest holder of US government bonds, in the amount of $1.19 trillion. Why would China make this move? One reason is that it may consider US treasuries less attractive compared to other assets. As well, it could be part of China’s strategy to flex some muscle as a possible trade war looms between the US and China, which are the two largest economies in the world. The report has pushed US Treasury yields higher and sent the US dollar downwards.
Gold prices have shown strong gains since mid-December, leaving many investors scratching their heads. A robust US economy and a December rate hike from the Federal Reserve have increased the appetite for risk, and the stock markets have pushed higher since the New Year. This should translate into lower prices for safe-haven gold, but the base metal has jumped on the bandwagon and posted strong gains in early January. On Friday, gold touched a high of $1326, its highest level since mid-September. Will enthusiasm for gold continue? Much will depend on the strength of the US dollar – if the greenback runs into headwinds against the major currencies, gold could resume its rally.
XAU/USD Fundamentals
Tuesday (January 9)
- 6:00 US NFIB Small Business Index. Estimate 108.4. Actual 104.9
- 10:00 US JOLTS Job Openings. Estimate 6.05M. Actual 5.88M
Wednesday (January 10)
- 8:30 US Import Prices. Estimate 0.4%
*All release times are GMT
*Key events are in bold
XAU/USD for Wednesday, January 10, 2018

XAU/USD January 10 at 12:25 EST
Open: 1312.86 High: 1327.85 Low: 1308.32 Close: 1316.80
XAU/USD Technical
| S3 | S2 | S1 | R1 | R2 | R3 |
| 1260 | 1285 | 1307 | 1337 | 1375 | 1416 |
- XAU/USD ticked lower in the Asian session. The pair posted strong gains in European trade but has retracted partially in North American trade
- 1307 is providing support
- 1337 is the next resistance line
- Current range: 1307 to 1337
Further levels in both directions:
- Below: 1307, 1285, 1260 and 1240
- Above: 1337, 1375 and 1416
OANDA’s Open Positions Ratio
XAU/USD ratio is showing limited movement in the Wednesday session. Currently, long positions have a majority (60%), indicative of trader bias towards XAU/USD continuing to move higher.
