Or as Bill the Bard of Avon might have queried, "Much Ado About Nothing?" Is the StateSide executive branch covertly concealing a felonious act? Or are players in the congressional/media complex destined to go down as the daftest deviants in decades? Either way, Shakespeare himself would be on the edge of his seat over such great theatre. To be sure, the markets certainly have so been, at long last getting their volatility in gear to sport some of their best swings of this year. Indeed for the EuroCurrencies and the S&P 500, this past week was their rangiest year-to-date.
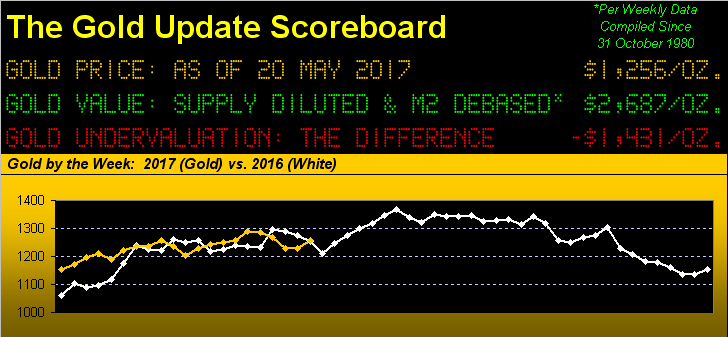
And Gold gained anew in the stirring of the brew, albeit as the above panel shows, price is just about spot on where 'twas at this point a year ago (1253) in settling out the week yesterday (Friday) at 1256. The bulk of the week's 28-point gain came during Wednesday's swift 24-point surge; but before we get too carried away, in turning to Gold's weekly bars, we presently find price all but smack in the center of the purple-bounded 1240-1280 resistance zone, the parabolic Short trend now three declining red dots in duration:
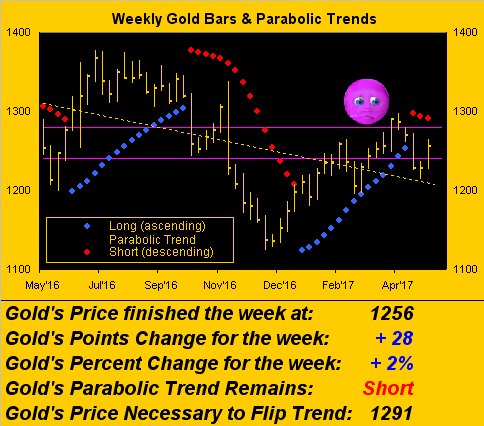
"Uh mmb, why is that trendline down if Gold is where it was a year ago?"
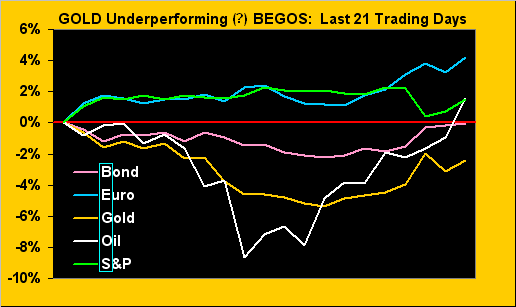
Good to see you doing some scrutineering there, Squire. 'Tis simply because the slope of the selling therein has been steeper that that of the buying. Which brings up this further point: we've noted over the years that, unlike most markets, Gold has a tendency to rise faster than it falls; clearly per Squire's good question, that has not been the case across the above chart. Moreover, given the geo-(and otherwise)-political climate, Gold has the appearance of underperforming a bit at present as seen in this next chart. Here we have for the last 21 trading days (one month) the percentage price tracks of our primary BEGOS Markets. Note specifically that Gold is off 2% from where 'twas a month ago, but that two of the markets with which Gold oft is positively correlated are firmer, the Bond being "unch" and the Euro being up a solid 4%:
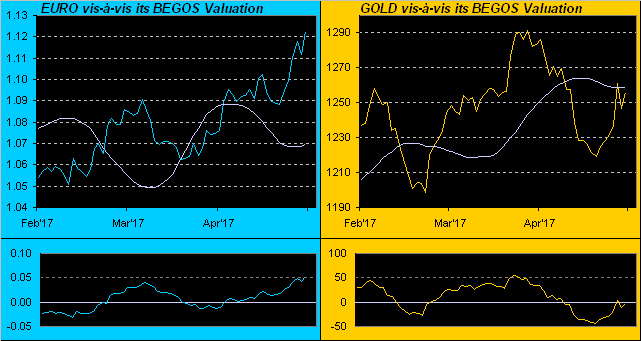
So why the "(?)" as to Gold's underperforming? If we go deeper into the data, we instead find 'tis the Euro that's not just been outperforming, but indeed overperforming. Here's technically why. The below two-panel graphic shows us for the past three months the Euro on the left and Gold on the right along with their smooth valuation lines borne of how price changes relative to the other components of BEGOS. The lower portion of the each panel shows the oscillator of price less valuation, by which the Euro is presently a full 5¢ (that's a ton!) "too high", if you will, above its BEGOS valuation, whilst Gold is basically spot on valuation. ('Course that doesn't preclude by debased currency valuation Gold being half what it "ought be" and in due course shall be). Here's the graphic:
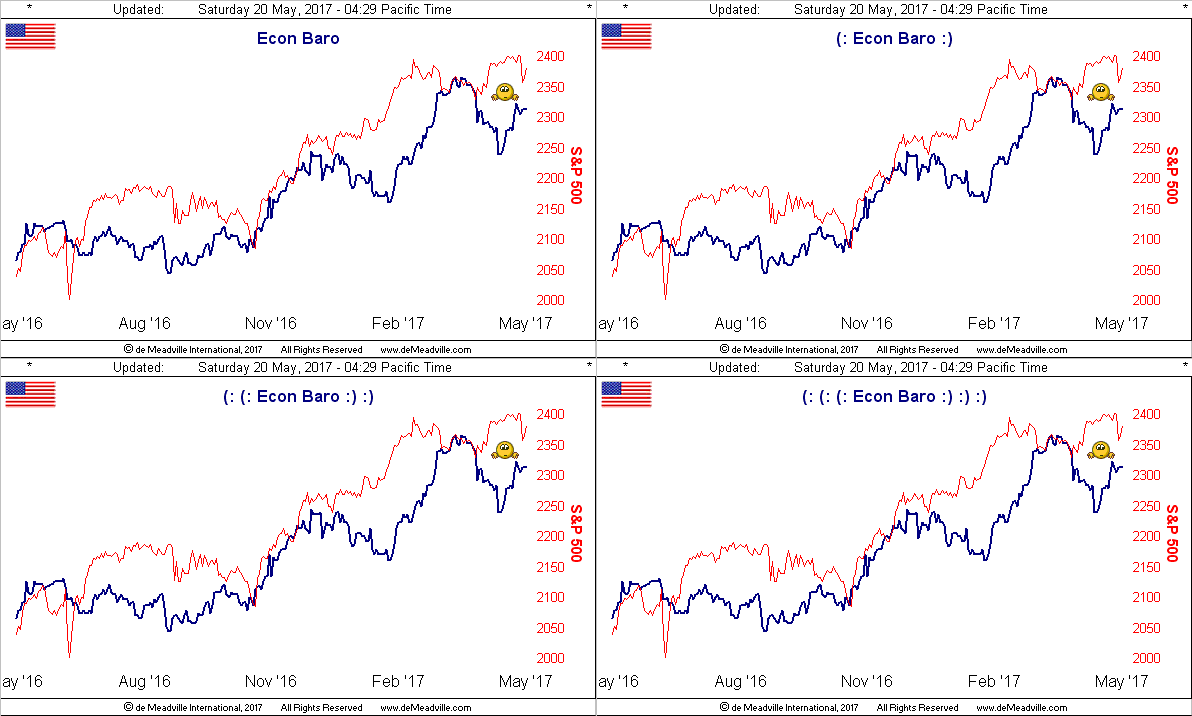
Economically, the past week's incoming data made it harder to get a grip on it all out there. Which is of course why we have the Economic Barometer, itself looking somewhat more uncertain, especially noting in the balance the vote for a rate hike from the Federal Open Market Comittee come 14 June. But talk about mixed metrics: The New York State Empire Index went negative -- but the Philly Fed Index soared through the roof, sporting its fifth best reading in almost 20 years; Housing Starts and Building Permits slowed -- but the lagging reading of Leading Indicators stayed steady at +0.3%. And amongst it all, the S&P made a marginally higher All-Time High, over which our smile was wry upon hearing Bloomy Radio in Tuesday's wee hours reporting markets as "smashing records": give it a rest already, will ya? I tell ya folks, be it mainstream, financial or even sports, we've reached the point where the word "media" ought be dropped for "mania". Here's the Baro:
More worldwide, the mighty Ford Motor Company (NYSE:F) announced 'twill boff 10% of its global workforce to boost its bottom line and share price, which at this writing is 71% below its 1999 high. Bonne chance. Meanwhile, European Central Bank Governing Council member Vitas "Vee Can Vait" Vasiliauskas says they ought announce the unwinding of stimulus before actually so doing. Very verifying. Then there's poor ole Alexis "Tieless" Tsipras down there in Greece, the economy of which shrank in Q1, austerity notwithstanding. Pass the Ouzo. All of which is to say that the more the world changes, the more it stays the same.
However, too often staying the same in the broad sense is Gold's price. As portrayed, Gold has been in and out and all about its 1240-1280 resistance zone these past 12 months, reaching as low as 1124 and as high as 2016's predicted top at Base Camp 1377. And yet as noted, here at 1256 we are at the same level 'round which we were a year ago. Perhaps traders' delight, but long-term investors' plight. At this rate, one wonders if in ten years the voice from the radio shall say "The Dow has reached 30,000 for the first time ever, Fed accommodation pushing the money supply across the $100 trillion mark; Oil is still clinging to the 200 level, while London Gold is 1279 the ounce." One can only hope the latter is not that then. But as for "the now", let's go to Gold's "Baby Blues" and 10-day Market Profile.
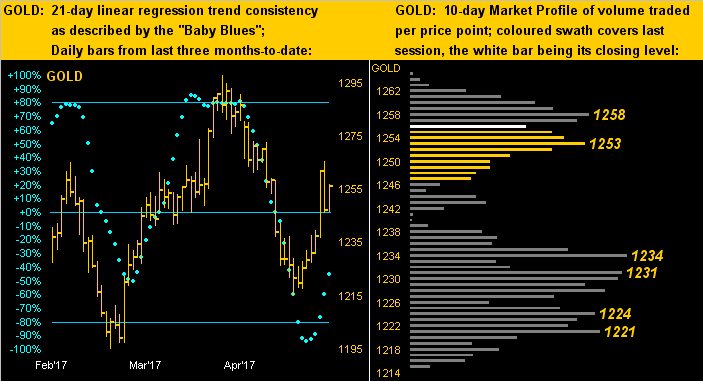
So per usual at left we've Gold's daily bars from three months ago-to-date, the cascading and now springing blue dots of 21-day linear regression trend consistency nicely climbing up and away from their -80% turnaround area; the key of course is to keep price climbing up and out of the aforeshown 1240-1280 resistance zone. Then at right in the Profile we find Gold, as suggested a week ago, having quickly filled the that central area which still appears somewhat void of trading volume: "Fergit da 40s, Fred; we're either gonna be up da 50s or down in da 30s!" How 'bout we just get to the 1300s, eh? Sheesh...
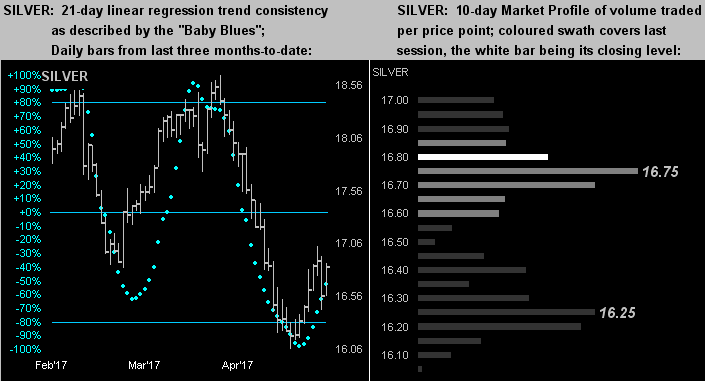
We've the same schema below for Silver. Note how her left panel overall carries a more negative tilt than that above for Gold. She certainly is running behind Gold, our Sister Silver: the average Gold/Silver ratio millennium-to-date is 62x, but the present reading is 75x. 'Course, Cousin Copper's being half what he was six years ago hasn't helped our Sis:
We thus roll into the new week, the economic highlight of which looks to be the first of two revisions to Q1's Gross Domestic Product growth, its initial reading of a rather docile +0.7% expected to be put up a pip or two toward +0.9%. To the extent such economic data gets lost in the ongoing Washington Ruckus one can only guess. Either way, it all ought keep Gold in play, and in having opened with an appropriate Shakespeare musing, why not close out with one more bruising ... "Double, double toil and trouble; Fire burn, and cauldron bubble..."