Specific to gold's 30-point (+2.8%) gain this past week, in the spirit of our oft referring to the otherwise foundationless fluff of fiat monies as "bow-wow currencies", we rightly ask: ![]() "Who let the dogs out?"
"Who let the dogs out?"![]() --(Baha Men, 2000). Answer? A couple of entities, really. The first was the International Monetary Fund, which on Monday welcomed China's renminbi to become yuan with the world reserve currency basket.
--(Baha Men, 2000). Answer? A couple of entities, really. The first was the International Monetary Fund, which on Monday welcomed China's renminbi to become yuan with the world reserve currency basket.
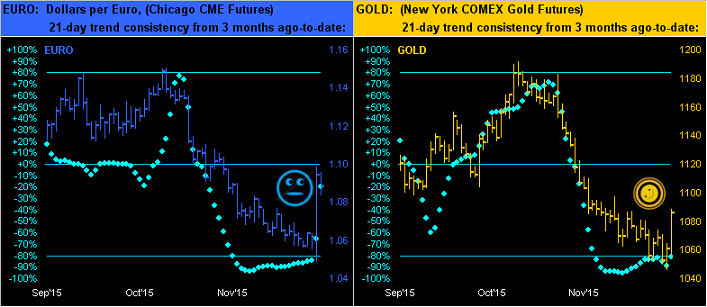
The second was the European Central Bank -- by a less-than-anticipated degree -- further planning to debase its €uroDog, in turn sending it through a violent Thursday thrashing, the whipsaw of which resulted in the largest percentage low-to-high intra-day gain in history: +4.097% (from $1.0490 to $1.0984) in just nine hours! Can you imagine working amongst such currency chaos that day in one of those tourist "cambio" shacks along the Piazza Duomo in Pisa? "Mamma Mia!" And as for the fallout for the dollar index that day, the intra-session percentage drop of -2.992% (from 100.600 to 97.590) was the 16th-worst in the last 30 years.
We thus begin our graphics parade with this two panel-view of daily bars for the last three months of the euro on the left and of gold on the right. Note those "Baby Blues," the dots which depict the day-by-day consistencies of the respective 21-day linear regression trends. That's one heckova €uroLeap!
In fact, whilst we're at it, let's as well consider a third entity behind gold's boost, for given the inverse logic, our "Sell the Rumour, Buy the News Dept." offers the furtherance of the week's FedSpeak as having removed all doubt -- save for the dubious fact itself -- that a rate rise has been essentially declared, thank you Madame "looking forward" Chair. Add to which yesterday's (Friday's) report on November payrolls was nothing short of fantastique, non?
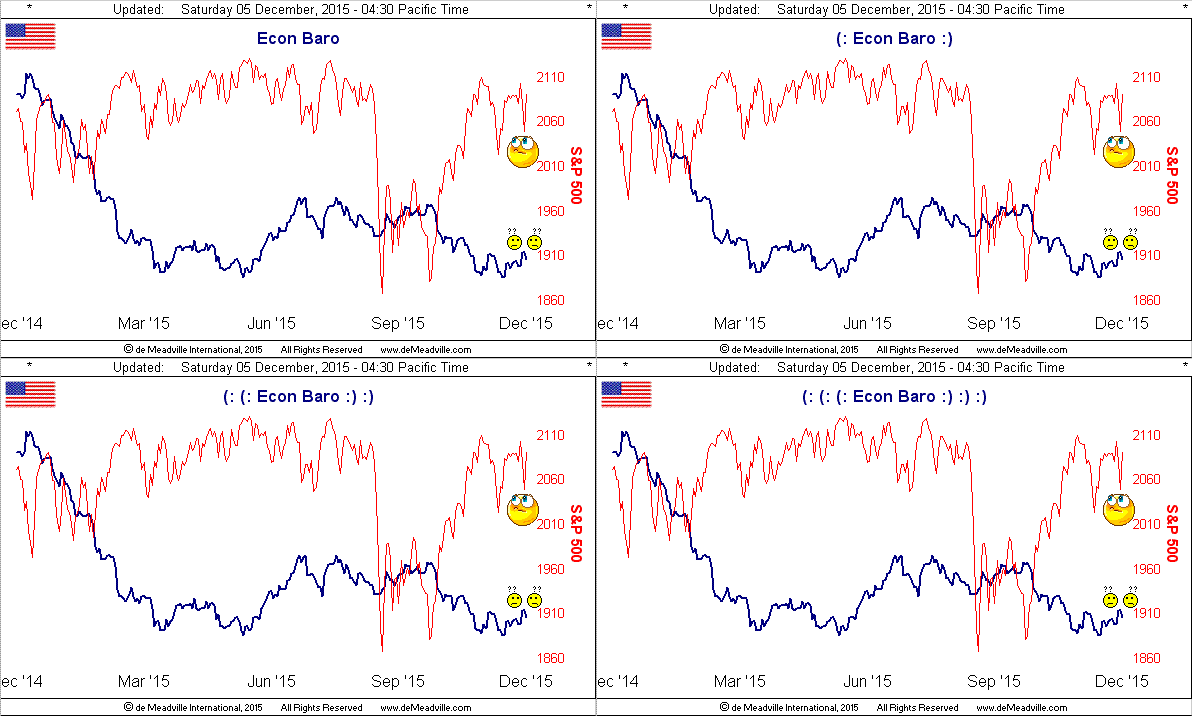
Not really. That said, and wrong as we may well turn out to be, we're still standing firm that the Federal Open Market Committee shan't nick up The Bank's overnight lending rate come 16 December. 'Course, were our Economic Barometer to suddenly spike up into hyper-growth next week -- a back-loaded one rife with inflation and retail sales data -- 'tis our "Reserve" to change our tune... but don't hold your breath. Here's the Econ Baro as updated right through yesterday's "glowing" payrolls report and "unspoken" trade deficit demise:
"Wow, mmb, it actually kinked down, huh?"
It surely do did, Squire, which highlights the fact that one number, in this case "payrolls", does not an economy make. As we've explained in the past, payroll creation hardly equates to job creation, (i.e. one 40-hr/wk job employing two 20-hr/wk payrolls). Folks make emotive declarations on headline numbers, but yesterday's Baro down-kink resulted from declines in the growth of both payrolls and hourly earnings, whilst average hours worked ticked lower, plus the trade deficit for which the prior read was revised for worse, the new read coming in worse still, and far worse than was expected. Economic negatives one and all. Fax it to the Fed.
Moreover, do you recall two weeks ago Atlanta Fed Pres Lockhart's pointing to global financial turmoil as having settled down, thus furthering the case to raise the rate? Faux dough fiat follies aside, the equity markets, too, are getting royally roiled: given an "expected daily trading range" of 19 points coming into Thursday, the S&P 500 then fell by as much as 37 points, but yesterday went back up by as much as 44 points. When this "Great American Savings Account" starts making such 2% daily swings, you might consider actually opening a real Savings Account: better to not grow one's dough than to see it go. (And just between you and me, our "live" S&P price/earnings ratio is presently 46.5x, but mum's the word, mum...)
Oh, and from the "Oh By The Way Dept.", did you happen to catch the results issued during the week of the Business Roundtable's survey of CEOs' economic outlooks? 'Tis now three quarters in-a-row wherein growing caution is being expressed over StateSide economic prospects near-term, with a curtailing of capital investments going six months out. Good thinking, guys: why borrow to invest and have to pay an increased rate of interest, sans the desired results?
A tip of the cap as well to Mohamed El-Erian, whose superb and in-depth 2008 tome "When Markets Collide" could really further its due here, the author this past week penning a piece entitled "As Fed Hikes and ECB Eases, Markets Could Get Wild" You got dat right, Mo! Maybe the rate ought instead go to zero!
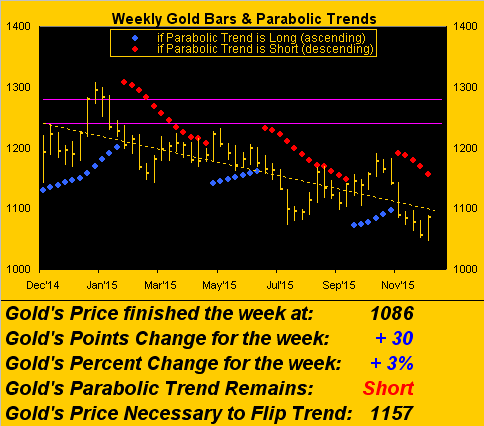
As for somewhat getting on the go, there's gold, our having already noted its 30-point gain for the week, in sporting its fourth-best percentage up move for 2015. Nonetheless, as we see here in the weekly bars, both the declining dashed regression trendline and red dots' Short parabolic trend remain well in force:
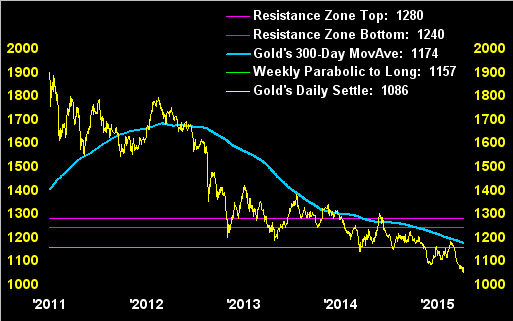
To be sure, many up weeks such as this last one are necessary toward determining "how we'll know when the bottom is in," our key technical criteria as stacked in this next graphic showing gold needing to:
1) turn the weekly parabolic trend to Long at 1157;
2) eclipse the 300-day moving average at 1174, and in due time turn that average itself upwards; and
3) have at least one full trading week above the 1240-1280 resistance zone.
Gold's good week notwithstanding, pictured this way, price presently remains pitiful per its daily settles since the All-Time Closing High of 1900 on 22 August 2011:
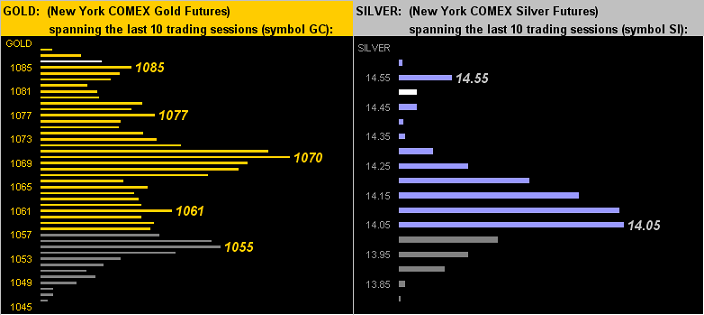
Still, with respect to you nearer-term traders out there, gold's strong finish to the week has placed its 10-day Market Profile in a far more supportive stance than we've seen of late. Thus below we've on the left gold's volume per price point from 20 November-to-date, and on the right the same for Sister silver. The white bars are the markets' respective 04 December settles:
And speaking of trading, we'll wrap it for this missive with the following observation. In a week run amok with frenzied markets headlines, we did read of the venerable Morgan Stanley (N:MS) planning to eliminate 25% of their currency and bond trading jobs, (again not necessarily their payrolls, nudge, wink, elbow, hint). But to stay on point, such scaling back is reportedly due to what has become a month-long slump in revenue from those trading activities. And let's face it: 'tis perhaps become a bit harder for the "Big Guys" to compete given that in recent years the GLOBEX trading mechanism has essentially "leveled the playing field" for us "little guys" in terms of ease of electronic entry on a first-come first-served first-filled basis. For example, if our man Squire puts in his limit bid to buy one euro futures contract at 1.0884, one second of ahead of Morgan's putting in to buy 100 contracts at same, upon someone hitting the bids, Squire gets his filled first. Clearly he's changing the game even at the highest levels.
"I'm the man, mmb..."
Oh you market-movin' non-professional rogue trader, you! (What a guy, eh?) Just keep those bids in on gold, baby.