Get 40% Off
👀 👁 🧿 All eyes on Biogen, up +4,56% after posting earnings. Our AI picked it in March 2024. Which stocks will surge next?Unlock AI-picked Stocks

Gold Fireworks Will Continue

Published 05/04/2021, 10:53 AM
Updated 07/09/2023, 06:31 AM

One more day of upside rejection for the S&P 500, in what is now quite a long stretch of prices going mostly sideways. As unsteady as the VIX seems at the moment, it doesn't flash any sign of spiking in this data-light week, and neither does the put/call ratio. As I wrote yesterday about the selling pressure, these tight-range days accompanied by 30ish-point corrections are as good as it gets when the Fed still has its foot on the accelerate pedal.

Yes, you can ignore the Kaplan trial balloon that spiked the U.S. dollar on Friday but didn't put a solid floor before long-dated Treasuries as seen in their intraday reversal.

The gold market enjoyed its fireworks, aided mightily by the silver squeeze run. The inflation theme is getting increasing attention, and commodities are on the run across the board. Just check yesterday's oil analysis or my bullish copper calls. I could just as easily say that copper is the new gold. It has been certainly acting as such over the past many months, yet the yellow metal's time in the limelight is about here.

When it comes to USD/JPY support for the unfolding precious metals upswing, we indeed got the reversal of Friday‘s USD upside:

(…) The taper story being revealed for a trial balloon that it is, would quickly reverse Friday‘s sharp USDX gains, where particularly the USD/JPY segment is worth watching.

Let‘s move right into the charts (all courtesy of www.stockcharts.com).

Gold and Miners Short-Term
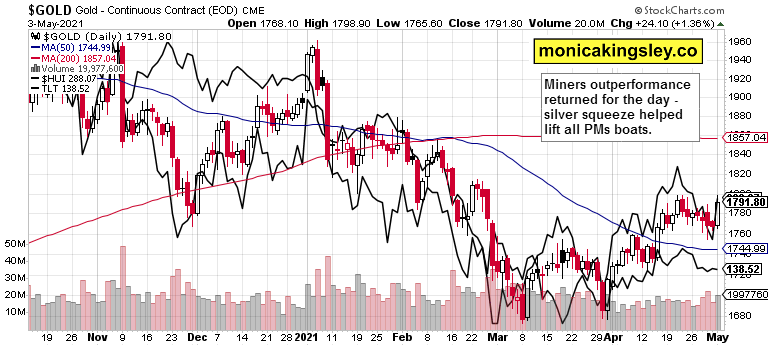
Gold Daily Chart.

3rd party Ad. Not an offer or recommendation by Investing.com. See disclosure here or remove ads .

Volume returned into the gold market, and so did miners' outperformance. While these didn't close anywhere near their mid-April highs, they extremely underperformed on Friday. What happens over the next few sessions will provide a clue as to whether strength genuinely returned yesterday.

Gold and Miners Long-Term
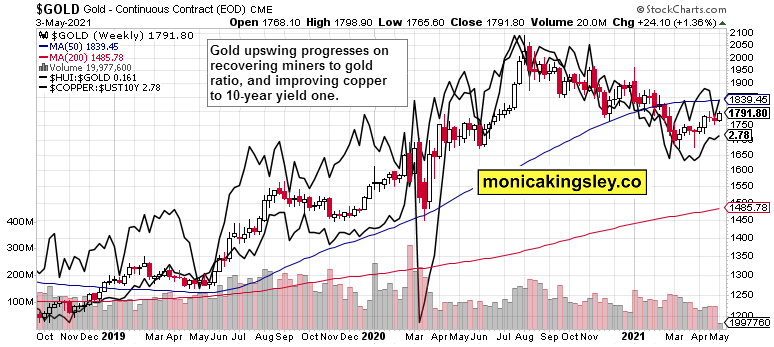
Gold Weekly Chart.

The copper to 10-year Treasury yield is edging higher again, and the miners-to-gold ratio strongly rebounded, proving my point that the real parallels are the 2018 and 2019 gyrations, not the uniquely deflationary corona crash.

Summary

The S&P 500 remains vulnerable to short-term spikes in both directions, but the medium-term picture remains positive. The strong gains since late March are being worked off here before another upswing.

Gold and miners proved themselves yesterday, and scored strong gains in a universally supportive array of signals across commodities, Treasuries, and also the USD/JPY daily move. It is well worth not retiring the benefit of the doubt given to the precious metals bulls. More gains are in sight.

Latest comments

can't understand what are you trying to say
It is that I see a few missing, not published paragraphs at the opening - have you checked the full ver at my site? Just come back here and tell me then how clear that was. Thanks and have a good day.
Risk Disclosure: Trading in financial instruments and/or cryptocurrencies involves high risks including the risk of losing some, or all, of your investment amount, and may not be suitable for all investors. Prices of cryptocurrencies are extremely volatile and may be affected by external factors such as financial, regulatory or political events. Trading on margin increases the financial risks.
Before deciding to trade in financial instrument or cryptocurrencies you should be fully informed of the risks and costs associated with trading the financial markets, carefully consider your investment objectives, level of experience, and risk appetite, and seek professional advice where needed.
Fusion Media would like to remind you that the data contained in this website is not necessarily real-time nor accurate. The data and prices on the website are not necessarily provided by any market or exchange, but may be provided by market makers, and so prices may not be accurate and may differ from the actual price at any given market, meaning prices are indicative and not appropriate for trading purposes. Fusion Media and any provider of the data contained in this website will not accept liability for any loss or damage as a result of your trading, or your reliance on the information contained within this website.
It is prohibited to use, store, reproduce, display, modify, transmit or distribute the data contained in this website without the explicit prior written permission of Fusion Media and/or the data provider. All intellectual property rights are reserved by the providers and/or the exchange providing the data contained in this website.
Fusion Media may be compensated by the advertisers that appear on the website, based on your interaction with the advertisements or advertisers.
© 2007-2024 - Fusion Media Limited. All Rights Reserved.