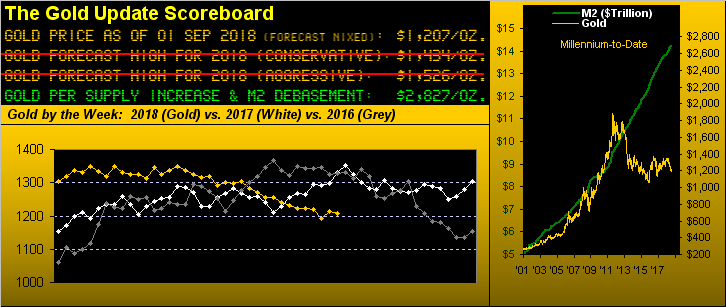
Two-thirds of the calendar year are gone. What else is gone? Gold. Gone down. Gone bad. Gone to hell in a hand basket. Gone to begging for handouts into said basket. As is Sister Silver: "She's gone ... oh I, oh I'd ... better learn how to face it"--(Hall & Oates, 1973)
Back then in '73, the "Gold Standard" had already been nixed by Nixon such that Gold settled the year at $106/oz. The U.S. national debt for 1973 was $458 billion. Today 'tis $21.5 trillion, (that's 4,594% more national debt, "manufactured" out of nothing). Increase the $106/oz. price of Gold by the corresponding 4,594% values it today at $4,870/oz. Oh but wait: from the "Let's Be Honest Dept." Gold's supply tonnage has since doubled. So let's halve that: $4,870/oz. ÷ 2 = $2,534/oz. Or, by our StateSide Money Supply (M2) debasement method in the above Scoreboard, the value of $2,827/oz. is pretty much in that same neighbourhood. We'd do a derivatives valuation as well, however our ever-trusty HP-12C (circa 1981) simply does not allow for the necessary number of decimal places. But as you voracious readers know, the "ought be" five-figure/oz. Gold Folks are out there.
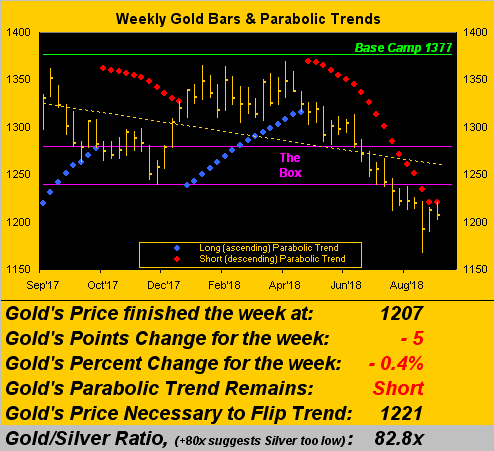
Either way, curious how 'tis trading at but $1,207/oz. by yesterday's (Friday's) settle. Indeed this past week marks the tenth one in the last five years that Gold has settled between 1200 and 1210. Much ventured, nothing gained. Much written, nothing changed.
"Are you actually capitulating, mmb?"
Good gracious, no, Squire! "Marveling" is more like it. And for month after month after month ad infinitum.
As for week after week after week of the parabolic Short trend spanning Gold's weekly bars, price could not reach up even the mere 10 points it so needed this past week to halt the descending red dots. As below shown, taking out 1221 still remains the near-term hurdle to herald a return to ascending blue dots. Here's the overall picture from a year ago-to-date, the rightmost third being nothing but down:
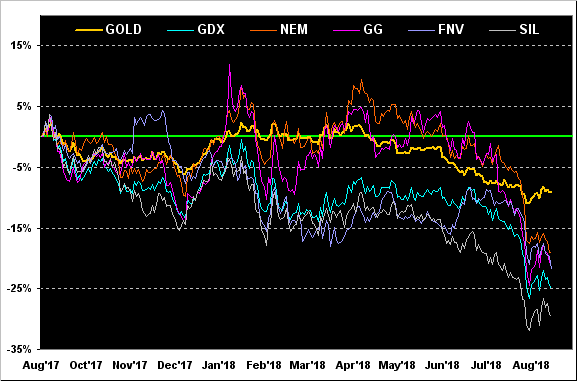
Indeed if Gold is the injury, then its equities brethren are the added insult. 'Twas a year ago at this point that we penned "Gold Superb through the Year's Second Third" ... from which we've witnessed The Great Unraveling. Since 31 August 2017, Gold itself is now -9%, Newmont Mining (NYSE:NEM) is -19%, Goldcorp Inc (NYSE:GG) is -21%, Franco-Nevada Corporation (TO:FNV) is -22%, the VanEck Vectors Gold Miners exchange-traded fund (GDX (NYSE:GDX)) is -25%, and the Global X Silver Miners (NYSE:SIL) -30%. Given the gradual decline, 'tisn't so much a crash, but nonetheless 'tis carnage:
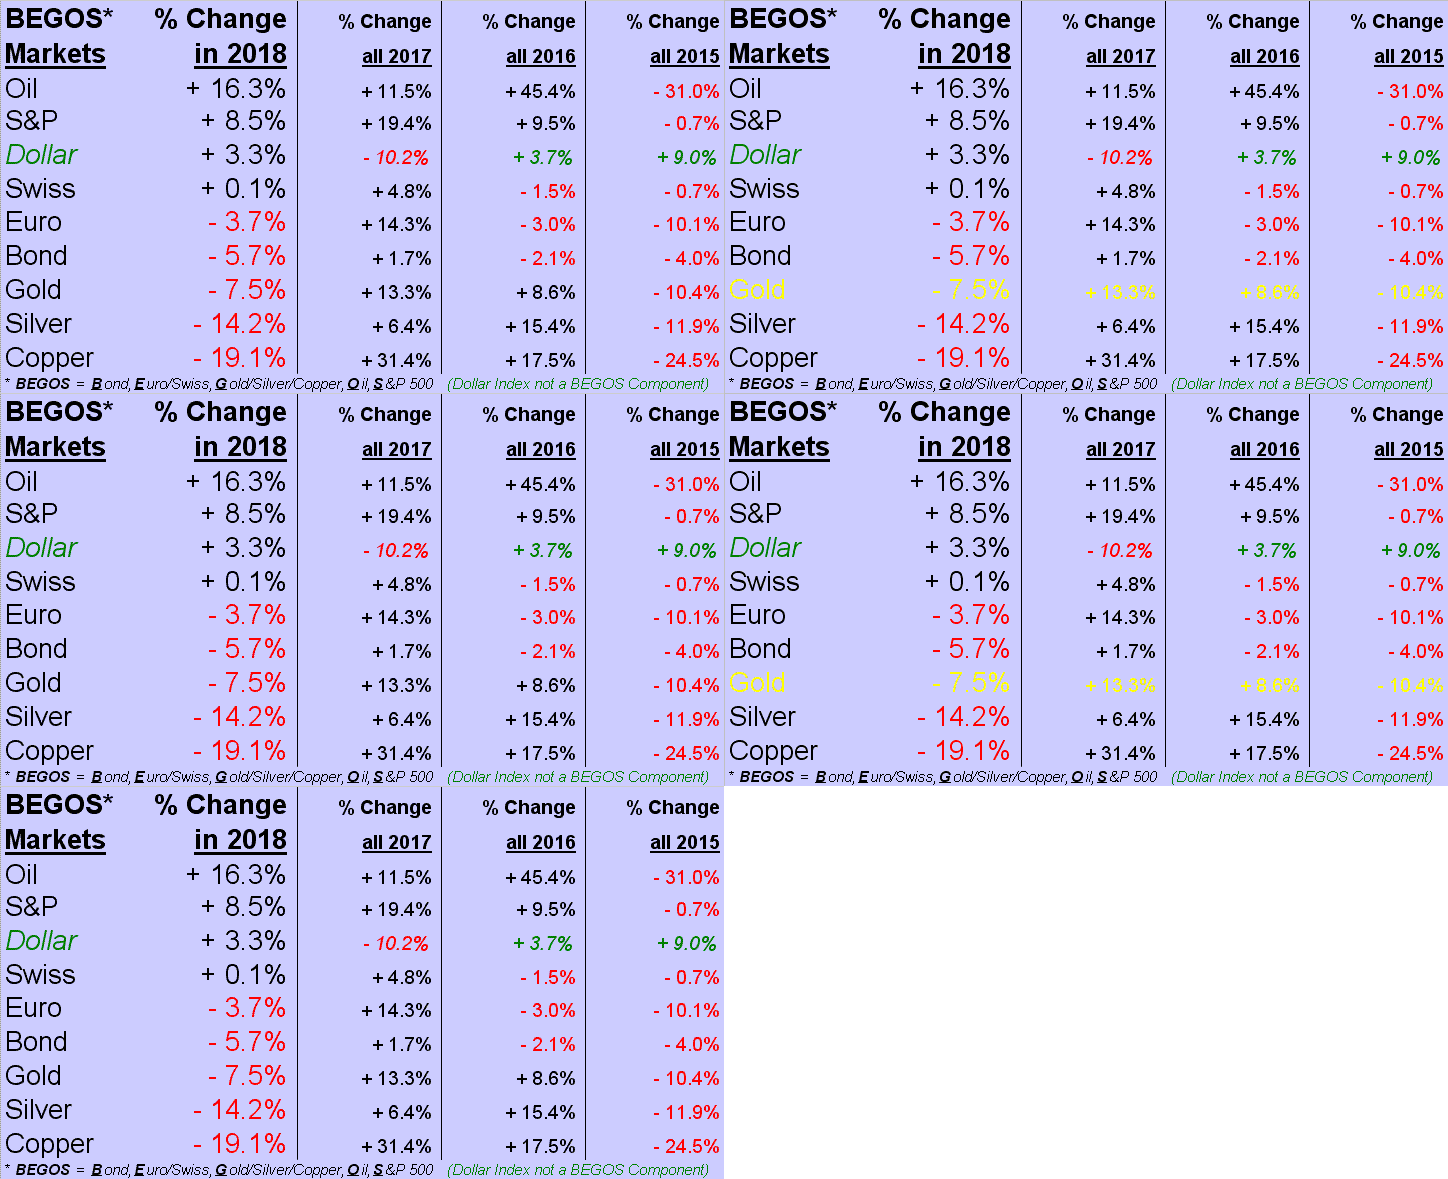
Moreover, to this point in 2017 Gold was +15% year-to-date, second only to Copper (+24%) in our BEGOS Markets Standings. Now for 2018-to-date, the metals are at the bottom of the barrel. Yet note how the Swiss Franc hasn't really succumbed as we'd typically "expect" with those markets listed below it. The sturdy Swiss and its currency canonists are perhaps the wiser as to what's coming (hint hint, nudge nudge, elbow elbow...):
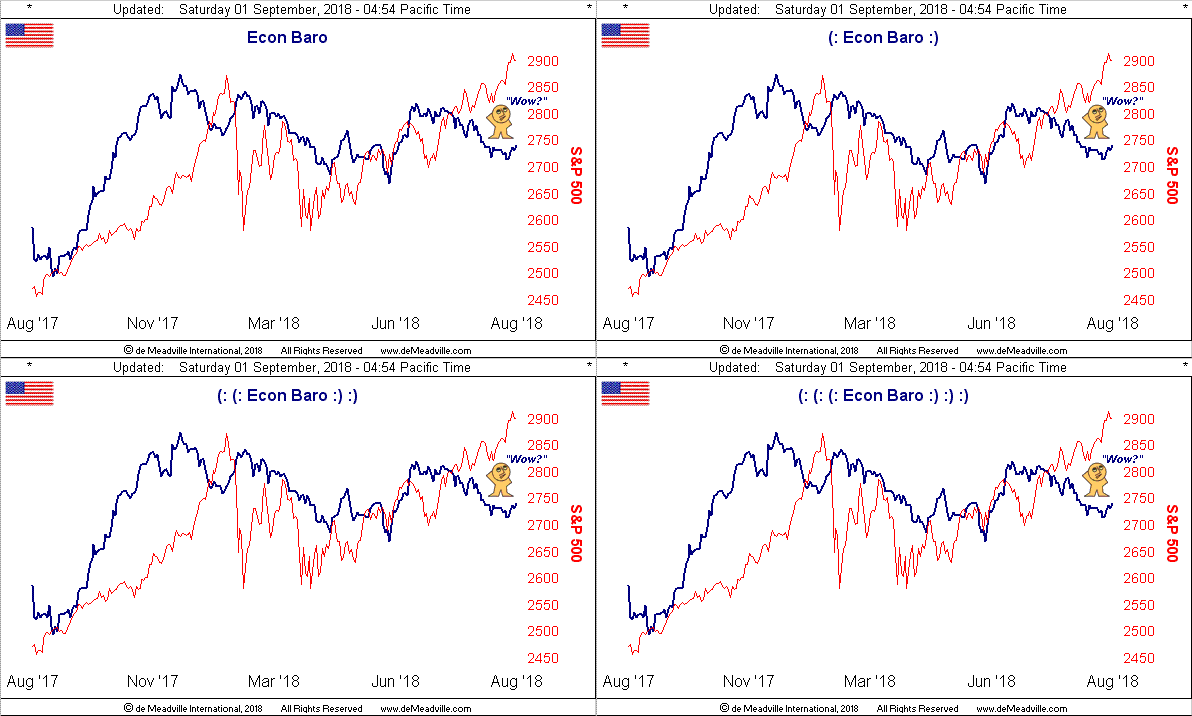
Coming ever higher is the record-making S&P 500, now trading above 2900 (where Gold ought be) for the first time ever, the Economic Barometer looking rather lost about it all. The past week brought us affirmation via Q2 of a 4.2% Gross Domestic Product growth pace whilst "soft" metrics of sentiment from both the Conference Board and University of Michigan suggest "everybody's happy" out there. And the Federal Open Market Committee's favoured measure of inflation -- that of Core Personal Consumption Expenditures -- ticked higher in July. Still, such mirth is mitigated by slowing growth in July's Personal Income, the month's Pending Home Sales falling, and the Chicago Purchasing Managers Institute's August read slipping. From a year ago-to-date, here's the S&P in red and the Econ Baro in blue -- and note how the Baro has ceased leading the S&P since June (tick, tick, tick...):
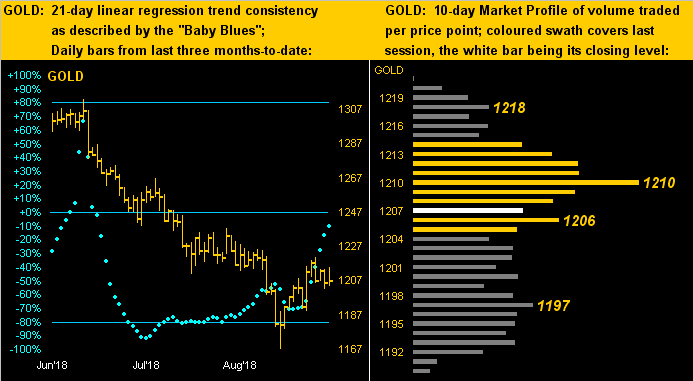
Elsewhere leading the way are Gold's rising "Baby Blues" but without price robustly in tow. At left below across Gold's daily bars for the past three months-to-date, we see the blue dots of linear regression trend consistency climbing out whilst price itself wanes. At right below, Gold's 10-day Market Profile finds price mired within the overall broad thicket of range, making the glass appear half empty -- or half full -- depending on one's point of view:
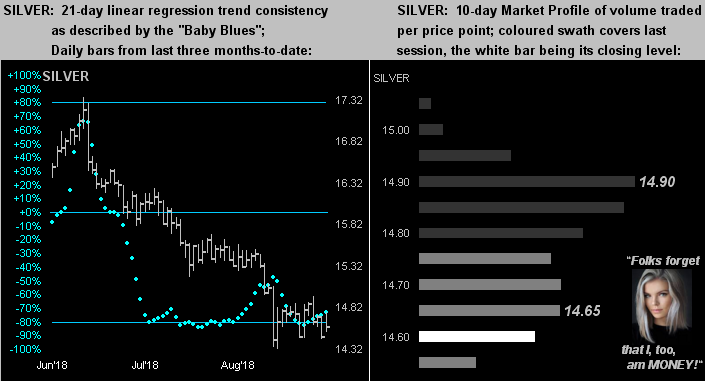
As noted earlier in the graphic of Gold's weekly bars, the Gold/Silver ratio has climbed up to 82.8x. This is rarefied air, (see our 03 February 2018 missive entitled "Gold/Silver Ratio Tops 80x - What Happens Next..." for all the nauseating detail thereto, and from which the ratio has yet to materially unwind). Worse as well for Silver as we see below right, her "Baby Blues" lack the upside alacrity of those for Gold, and further in her Profile below right, she's buried at the bottom. Oh cries Sister Silver: "I've lost my photographers as well as my dentists!" Never let it be lost, dear Sister, that more than anything else you are MONEY, honey!
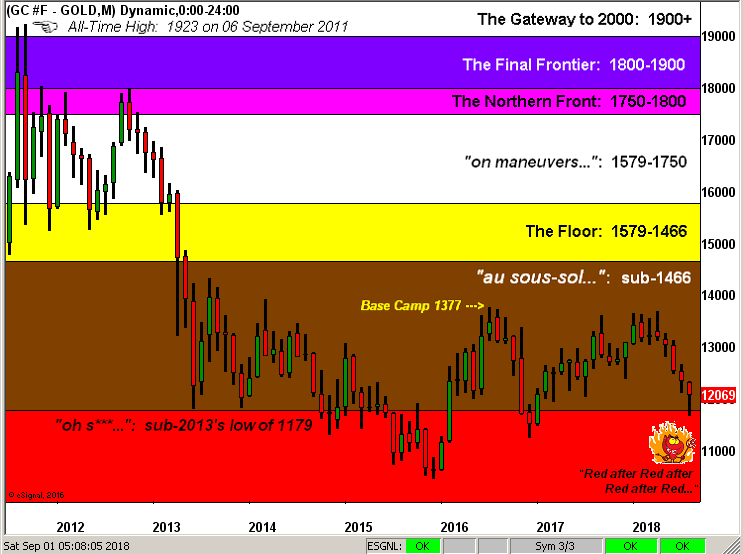
However, hardly as sweet as honey -- despite their similarity in colour -- is Gold. And our wee fellow down there at lower right knows it as we turn to Gold's Structure by the month since price's All-Time High nearly seven years ago to the day. Gold has now closed lower for five consecutive months for just the 11th time (on a mutually-exclusive basis) across the 524 months from January 1975-to-date. Therein, Gold has fallen for a sixth consecutive month just three times (and not since 1989), and never for a seventh consecutive month. To be sure "Buyer beware", but at the same time "Buyer don't get left out". Here's the graphic with its defined major strata:
Finally, let's close with a note on the Federal Reserve Bank. Two headlines caught our eye this past week, one being published directly atop the other as follows: