People relax. It’s a correction.
If you’re a serious gold investor, then I sympathize.
If you’re freaking out, then this is not for you. If you’re anxious, then you need to check your premises.
After all, what’s changed since gold reached a new all-time nominal high over $2,000 last August?
Actually, most of the fundamental drivers that support gold have simply gotten more entrenched. And that ultimately means much, much higher gold prices over the next few years.
So the current rout becomes a matter of perspective. After all, we’ve set a lot of records lately – in a bad way. Unless you think record levels of debt, record low interest rates, record high stock valuations and record levels of money supply will hurt gold prices, then relax.
In the meantime, it’s helpful to just try and better understand what’s pressuring gold. That way we can decide if its weakness is transitory or structural.
Odds are you know where this is going. But let’s work through it anyways, you know, for fun.
Rising Yields, Deficits And Debts
My take on what’s been pressuring gold for the last few months boils down to one main factor, the rise in long-term yields.
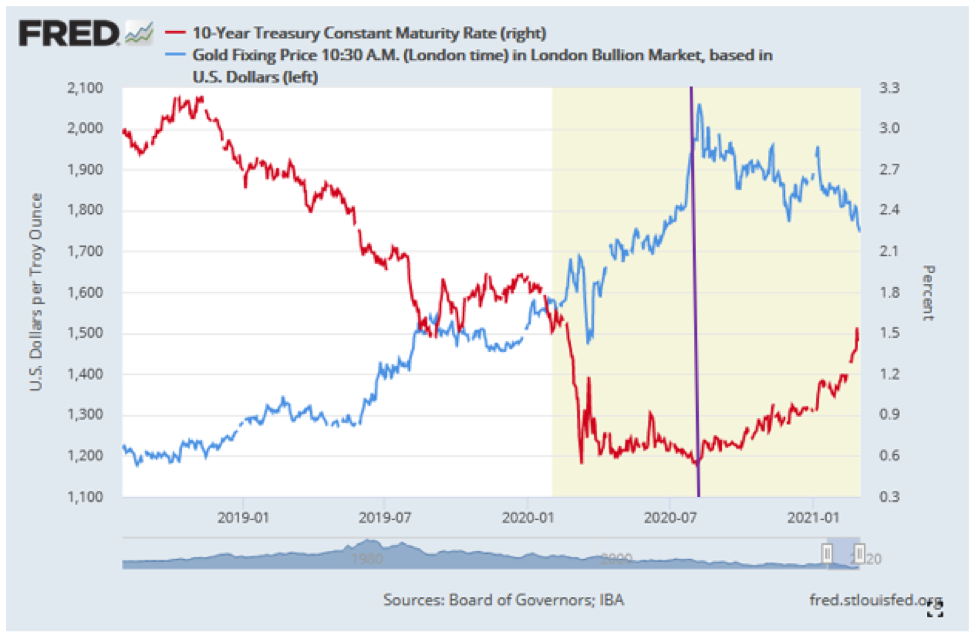
Bond yields have been on a path higher since early August. It’s no coincidence that gold started to correct at virtually the same time. Gold pays no dividends. And investors have become attracted to higher bond yields as stocks have gotten even more pricey.
Intertwined with that is the rising U.S. dollar. As the rise in yields accelerated when we entered 2021, foreigners likely began converting their currencies to dollars to buy U.S. bonds. That has prompted a rally in the U.S. dollar index which could have a bit higher to go before peaking.
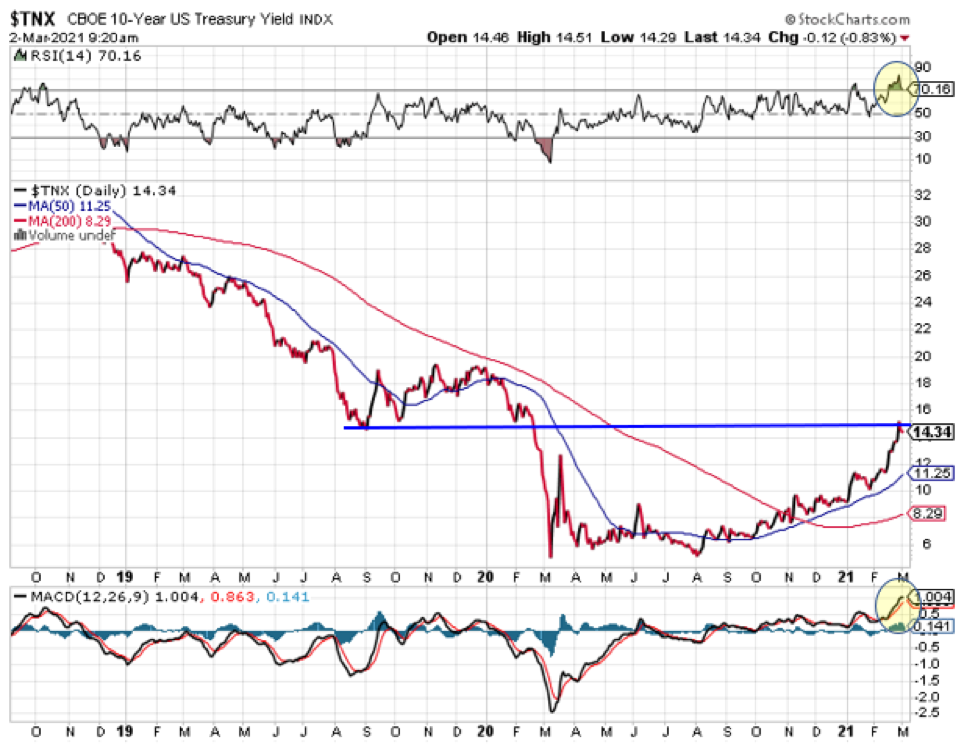
Judging by the RSI and MACD momentum indicators, the 10-Year Treasury Index is looking overbought. And the 1.5% ten-year yield level, which acted as support several times in late 2019, may now become resistance.
Meanwhile, U.S. deficits are screaming higher. As explained in Crescat Capital’s February Research Letter, there’s an impending $1.9-trillion “rescue” package. In addition, Biden is aiming for a “recovery” package. While still in discussions, it may reach as much as $3 trillion. The total could reach $4.9 trillion, as compared to last year’s $3.1 trillion. And last year major foreign holders of U.S. debt bought a measly 5.2% of all treasuries issued.
That leaves the Fed as a buyer of last resort, naturally. Let’s look at what that’s meant for more than the past decade.
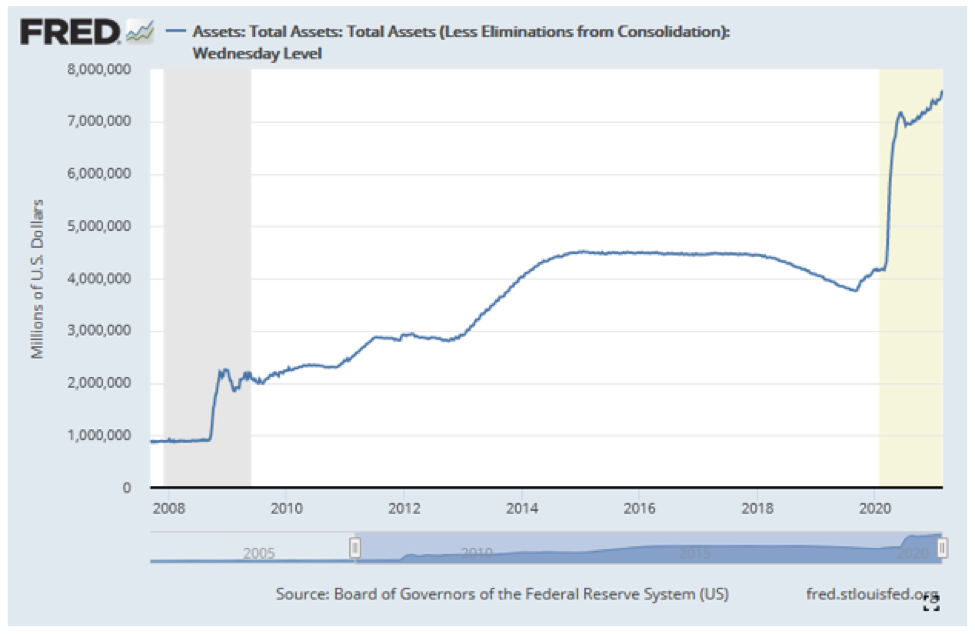
One big standout, for me, from this chart is how short-lived and relatively shallow any asset reductions were. The most obvious takeaway, naturally, is the sheer amount of growth in assets. Over the 12 short years from 2008 to 2020, assets have blasted from $1 trillion to $7 trillion.
Now lets’ step back for a little golden perspective.
Gold’s And Gold Stocks’ Big Picture
If we look at a 20-year gold chart, the recent correction takes on a different context.
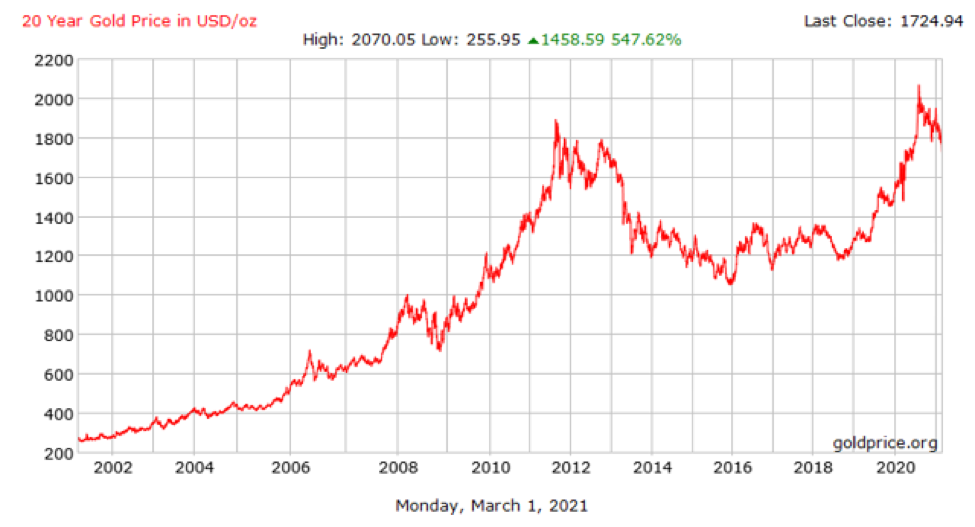
Consider that gold’s big upleg from late 2018 until its 2020 peak took it from $1,175 to $2,070. That’s a 76% gain in just two years. And it certainly justifies its current correction.
Looking at a 2-year chart suggests gold’s correction may be nearly done.
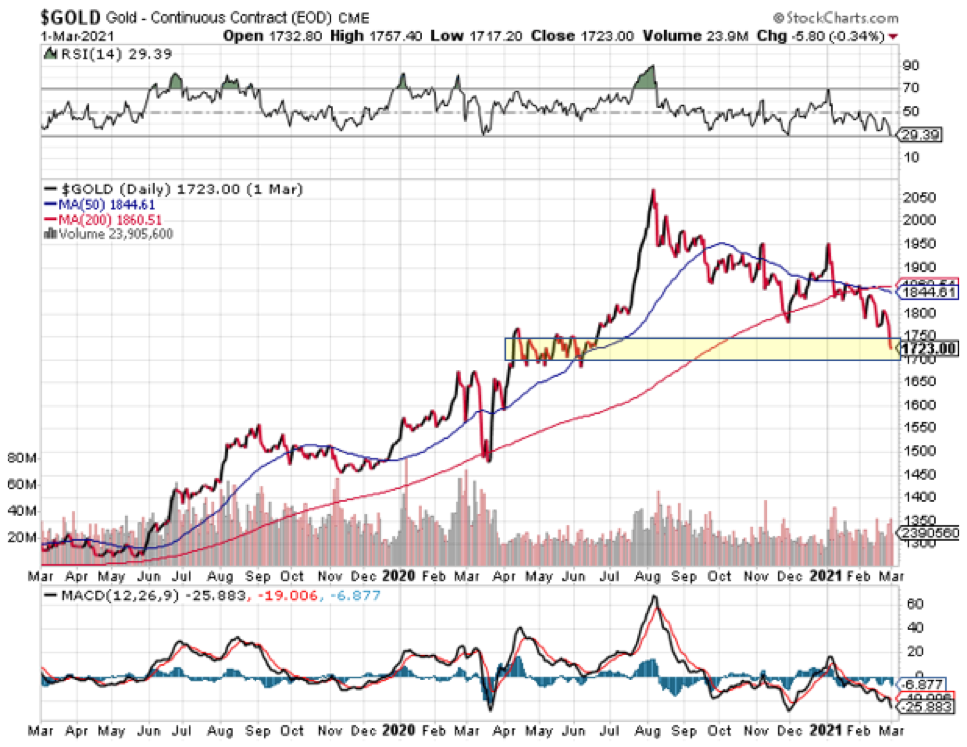
Last April to June there was a confluence of trading in the current range around $1700 - $1,750. And the RSI and MACD indicators suggest gold is at or very near oversold levels.
From price and sentiment perspectives, gold stocks also look like they’re near their nadir.
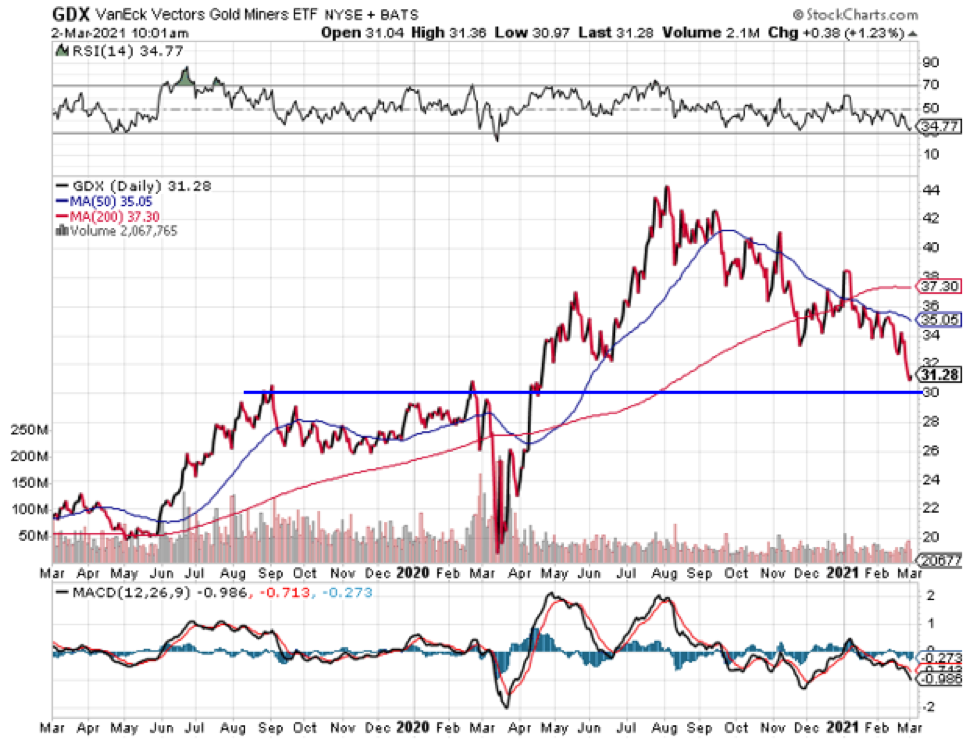
The bottom for VanEck Vectors Gold Miners ETF (NYSE:GDX) could well sit near the $30 level. The RSI suggests a little more work needs to be done.
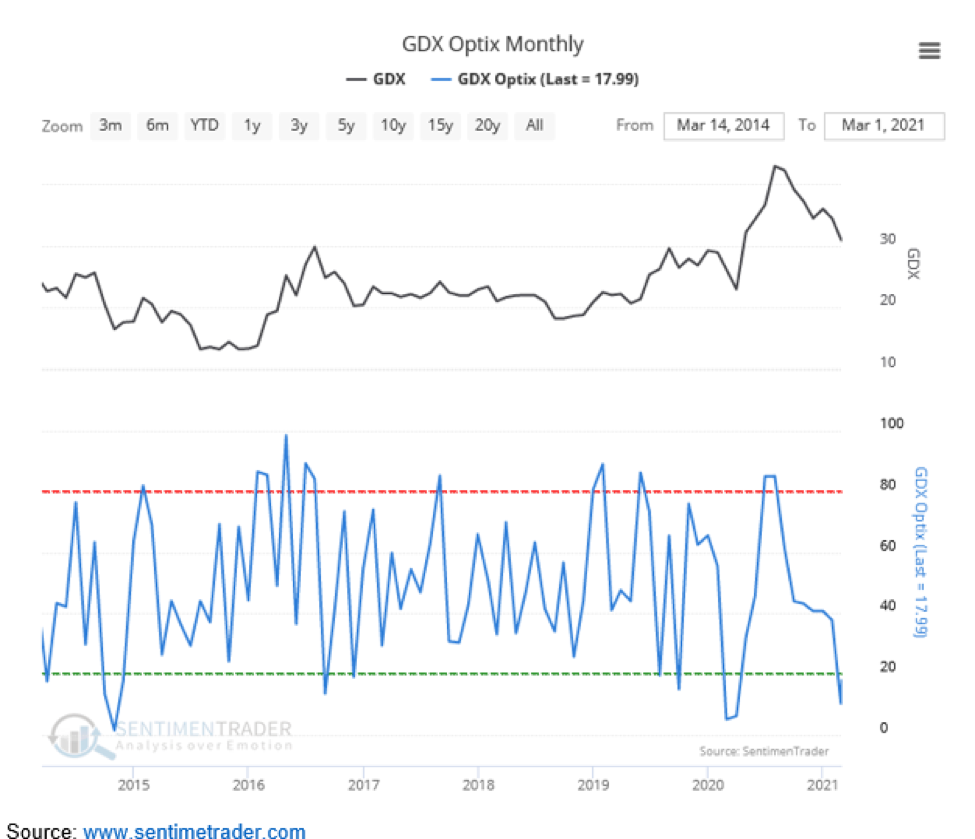
And from a contrarian sentiment perspective gold stocks have only been this hated, and therefore attractive, twice in the past decade.
So the bottom line is that gold at $1,700 is not a reason to freak out. Instead, it needs to been seen for the opportunity that it is. In all likeliness, after eight months of correcting by nearly 18%, we are at or near a bottom.
It’s time for you to decide. Is the current gold price a crisis or an opportunity?
Logic would dictate the latter.
