Gold Rebounded On FOMC Minutes
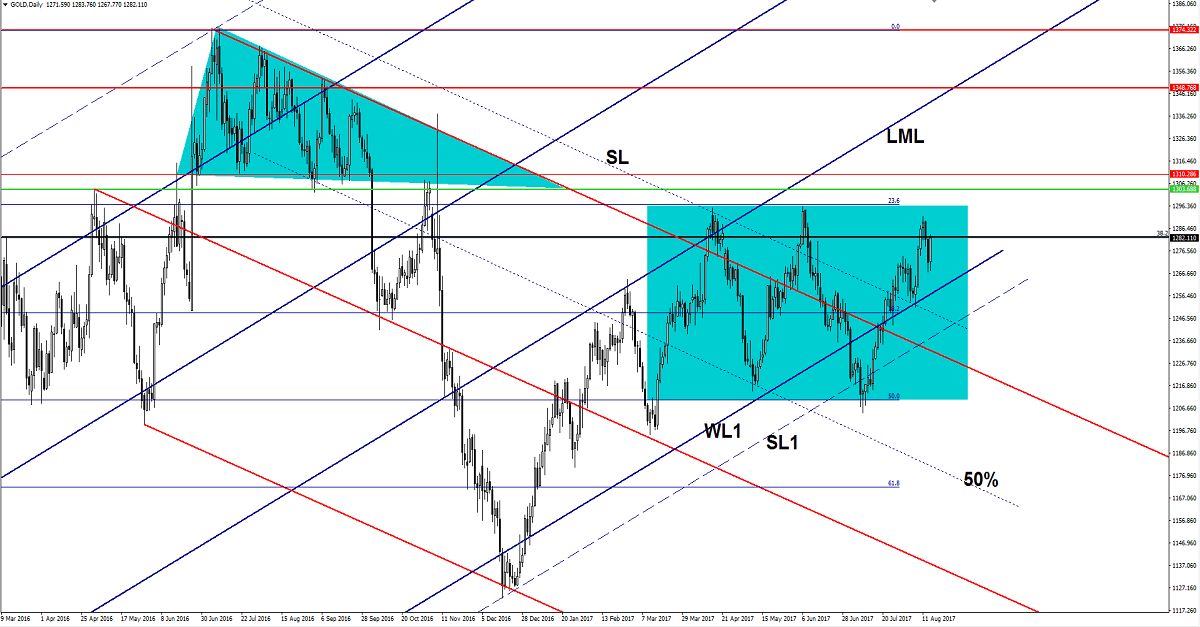
Gold rallied aggressively after the FOMC Meeting Minutes release and now tries to take out a strong horizontal resistance. Price increased as the USD was punished by the dovish FOMC Minutes and by the poor US data. The yellow metal move in range on the daily chart, could resume this extended sideways if will fail to close above the 1292 previous high.
Gold may increase further as the Kiwi and Aussie appreciated significantly versus the greenback, the currencies could receive a helping hand from the Australia and New Zealand in the early morning. The New Zealand PPI input could increase by 0.9%, more versus the 0.8% in the previous reporting period. On the other hand, the Aussie is waiting for a helping hand from the Australian Employment Change, which should increase from 14.0K to 19.8K, while the Unemployment Rate could remain steady at 5.6%.
Price is pressuring the 38.2% retracement level, should close and stabilize above this level if the USDX will drop much towards the 93.00 psychological level. Is trading in range and a failure to climb and close above 1292 will signal a major drop. Is premature to say what will happen, but the failure to reach the $1295 per ounce and to reach the 23.6% retracement level signaled an exhaustion on the short term.
Price is located in the green zone as long as is trading above the warning line (WL1), but a drop below this level will open the door for a broader drop.
Brent Oil Throwback Favored
![]()

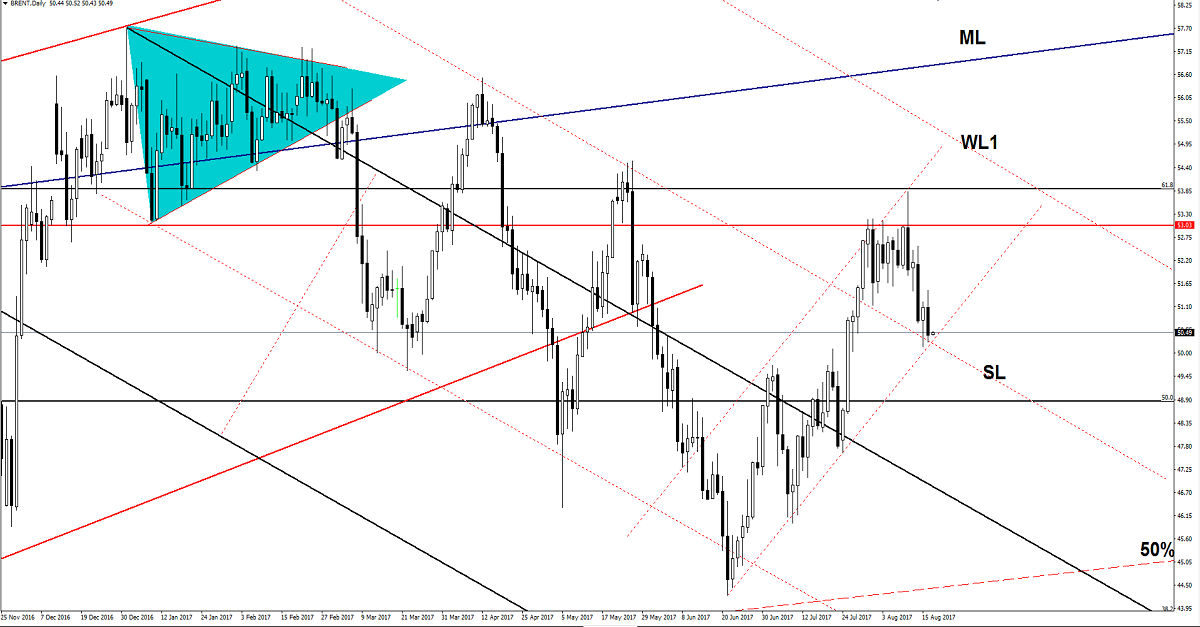
Price is trading within a minor ascending channel, the perspective is bullish as long as is trapped within this channel. Has come down to retest the downside line of the chart pattern and the sliding line (SL) and now is expected to bounce back. Is trading near the $50.50 per barrel, and above the confluence area formed by SL with the downside line of the ascending channel. Only a valid breakdown will confirm a further drop.
EUR/CHF On The Way Down
![]()

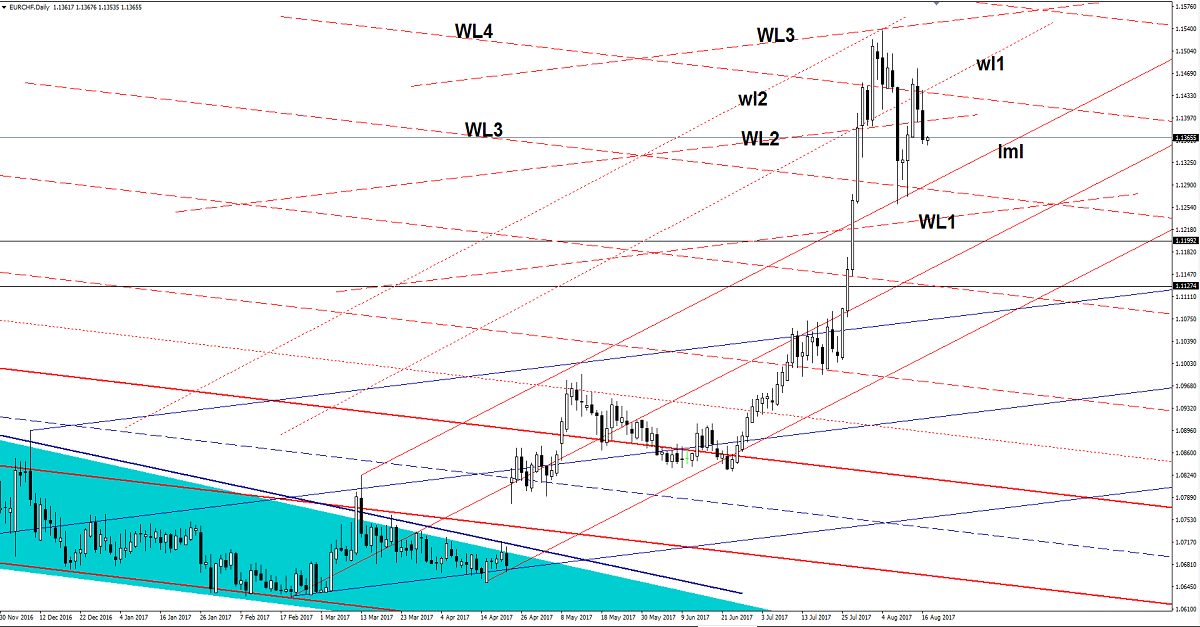
Price is into a corrective phase, after the false breakout above the WL4 and above the first warning line (wl1) of the minor ascending pitchfork. A retest of the upper median line (ml) is favored at this moment, we’ll see what will react then. A breakdown below the upper median line (uml) will signal a major drop in the upcoming weeks.
Risk Disclaimer: Trading, in genera,l is very risky and is not suited for everyone. There is always a chance of losing some or all of your initial investment/deposit, so do not invest money you can’t afford to lose. You are strongly advised to carry out your independent research before making any trading decisions. All the analysis, market reports posted on this site are only educational and do not constitute an investment advice or recommendation to open or close positions on international financial markets. The author is not responsible for any loss of profit or damage which may arise from transactions made based on any information on this web site.

