For gold investors, 2018 is yet another year that promised much at the start, before a combination of factors conspired against the precious metal. After a fast start, gold subsequently failed to hold gains, and instead developed that relentless momentum lower which we have seen many times before.
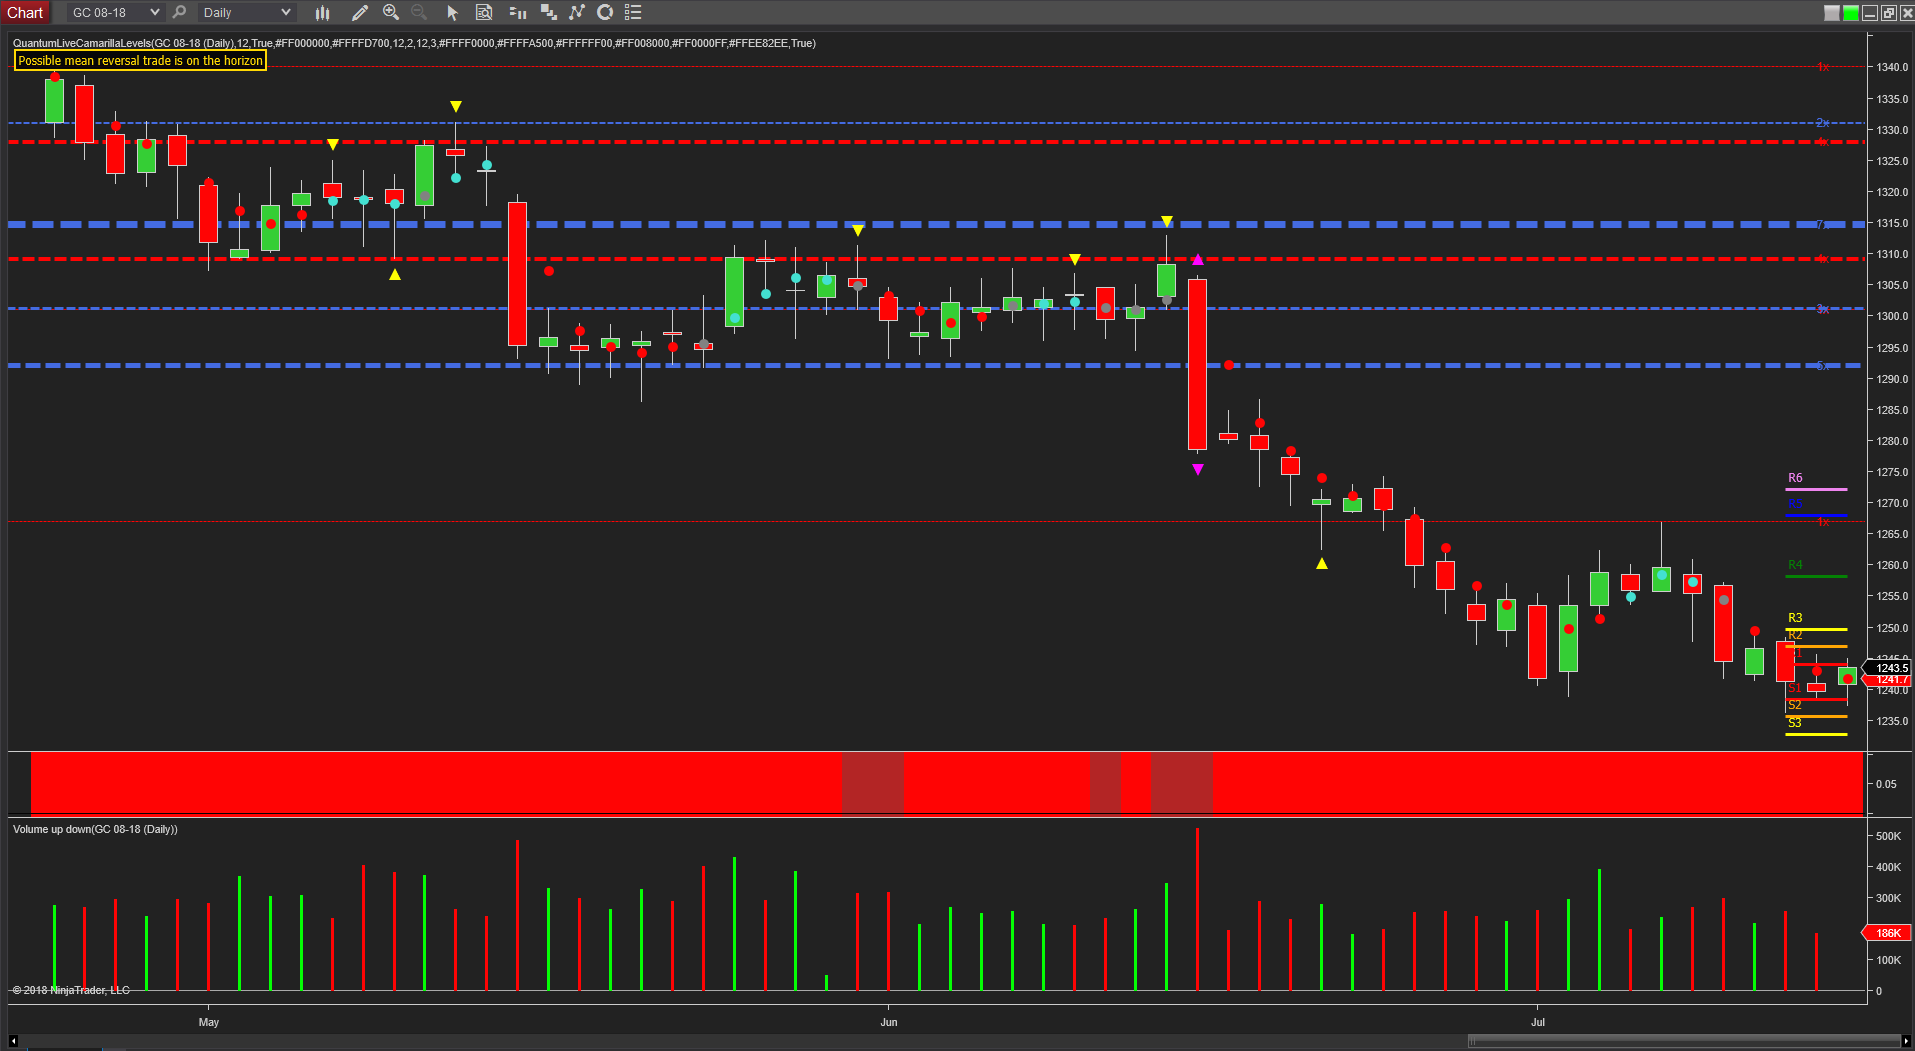
So where next for gold? If we start with the daily chart, the bearish progress lower is almost metronomic, with each pause and congestion phase followed by a swift move lower, before this pattern of price behaviour is repeated at a new, lower level. The two wide spread down candles of mid May and mid June reinforce the point, moreso when viewed in conjunction with the associated volume on both days which was extreme, confirming the heavy selling by the big operators.
This also highlights the opposite side of the coin, namely a distinct lack of buying volumes on those days when the metal attempted to rally. Indeed, the most recent rally on the 5th July with a narrow spread candle on high volume was classic volume price analysis. This volume signalled selling into weakness, which duly arrived a few days later.
We are now trading well below the volume point of control which is anchored just below the $1300 per ounce area, adding further downwards pressure. Although the price action has managed to capitalize on last Friday’s buying in the $1235 per ounce region, and temporarily stem the bearish momentum, this halt in momentum is only likely to be a pause point.
The bearish momentum is also confirmed by the trend monitor, which has remained red since mid April and which accelerated following the volatility candle of the 15th June. Moreover, the precious metal has also benefited from some weakness in the USD which has seen the US Dollar Index pull back from the key 95 price level.
The present move higher in gold now sees the precious metal consolidating in the camarilla neutral or buffer zone, namely between the first resistance at $1245 and first support at $1238. Only a clear breach of the former on good volume will signal the possibility that gold may at last be regaining some of its lustre.

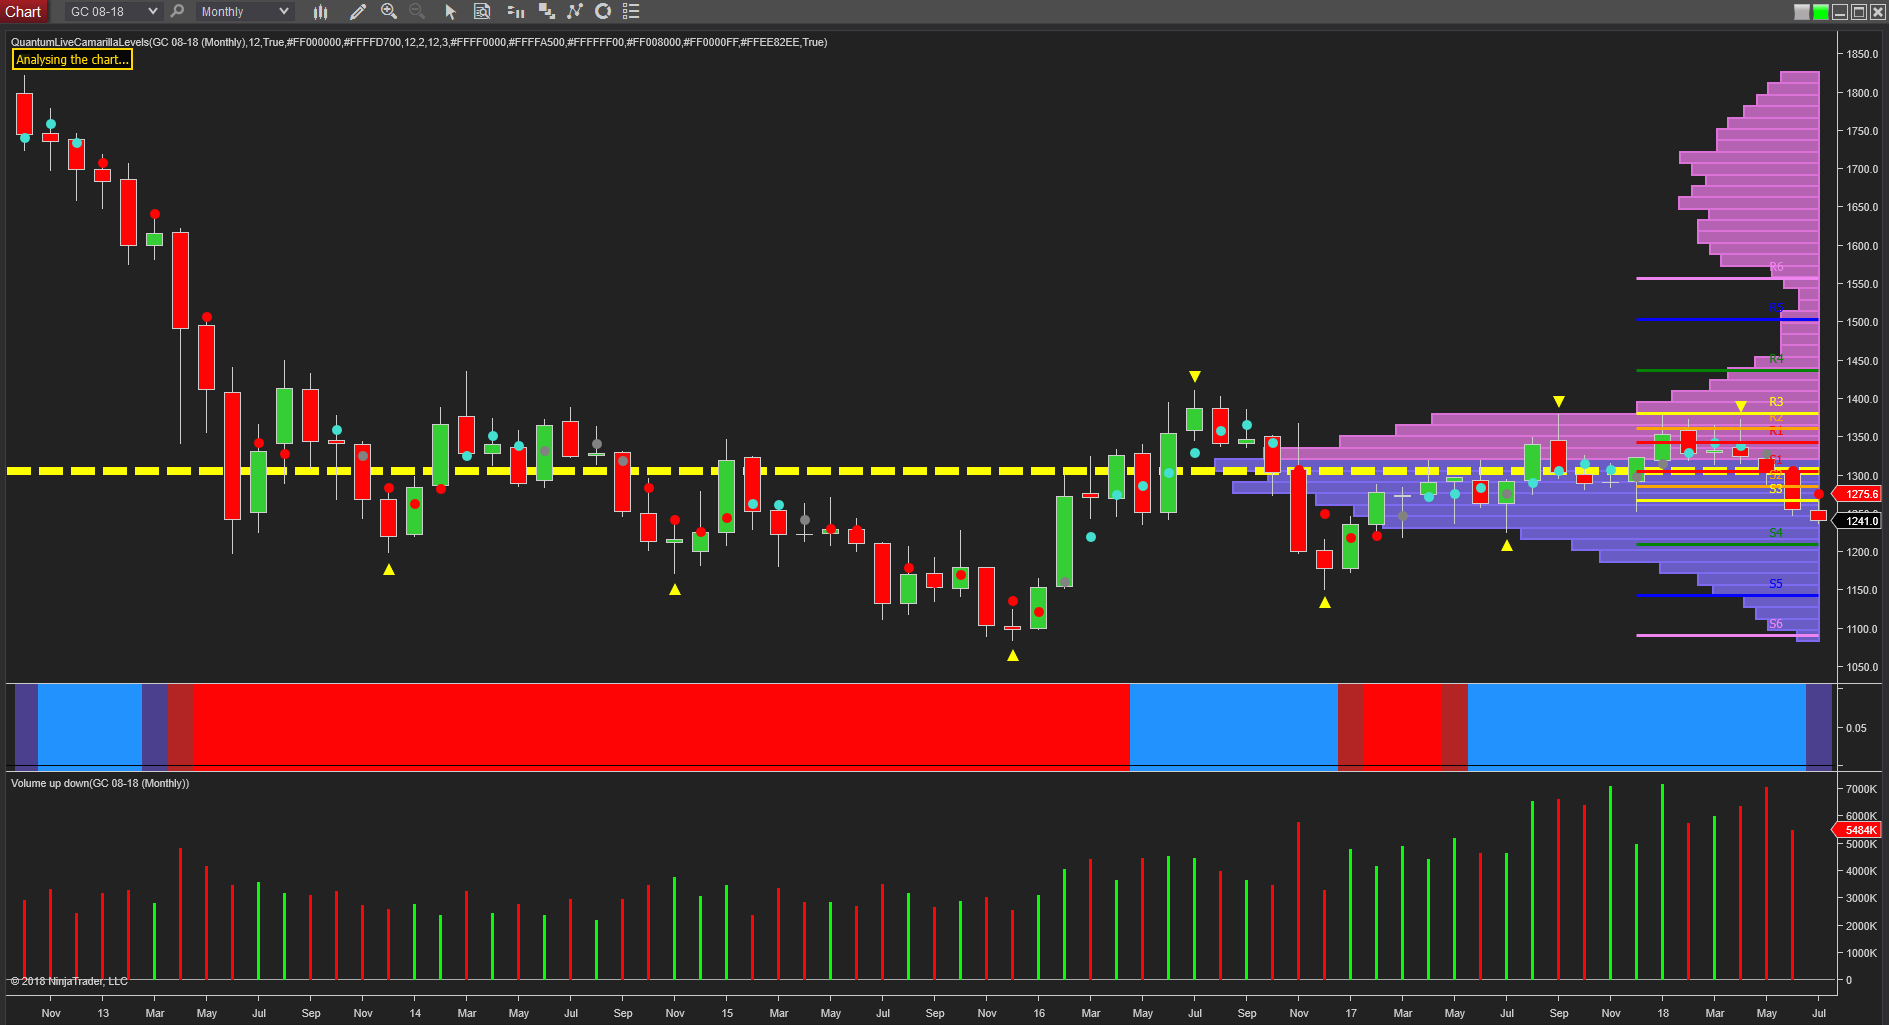
However, the monthly chart paints a very different picture, and here we see a heavily bearish picture for gold in the longer-term for several reasons. First we have the well developed ceiling of resistance in the $1370 per ounce area which has capped all recent attempts to rally and extends back as far as 2014.
Next we see the extreme volumes of January and March with strong selling once again in evidence into the associated narrow spread price action which failed to follow through and hold the highs of the session. Then we come to the camarilla levels, which are perhaps the most revealing and significant.
During July we have seen the price of gold move through the S3 level and begin to approach the S4 level in the $1200 per ounce region which is now key. If this level is breached, then a full blown breakdown in price is likely with a potential move to test the S5 level at $1145 per ounce or deeper. This could then go to the S6 which takes gold below the $1100 per ounce price point once again. Note also the decreasing volumes on the volume point of control, which provides little in the way of resistance to such a move lower.
For investors and gold bugs, 2018 looks like its becoming another year to forget. And with US dollar strength returning and inflation continuing to remain hard to create, gold looks set to react to risk more strongly for the time being, though not for any sustained period which provide a reversal in the longer term picture. If and until buyers return with sustained volumes that are sufficient to break and hold above some stiff resistance, the bears look set to remain in full control, with the camarilla levels now mapping the way ahead.
