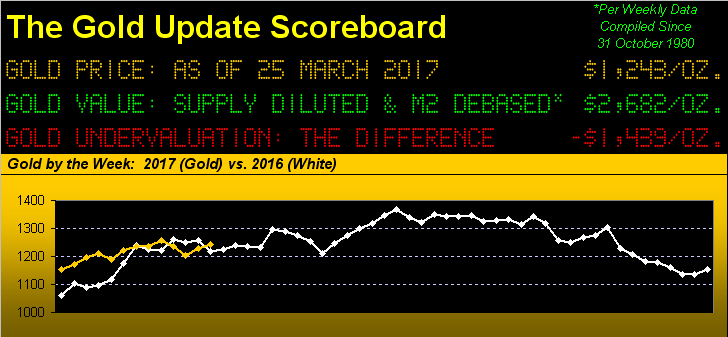
'Tis a grand old expression, what? "It feels so good to be home!"
"Uhhh, mmb, what's so good about Gold being at 1243, and as you like to say, 'per the above panel', only moving around where it was at this time last year?"
In being purposefully facetious, Squire, we're merely pointing out that Gold is once again back "home" in the 1240-1280 resistance zone. After Gold reached its All-Time High of 1923 back on 06 September 2011, the perilous price descent we've since endured reached to as low as 1046 (-46%) on 03 December 2015, fortunately from which price is now 19% higher, your noting its having settled out the week Friday at 1243. But now again, this irascible 1240-1280 resistance zone looms large in the details.
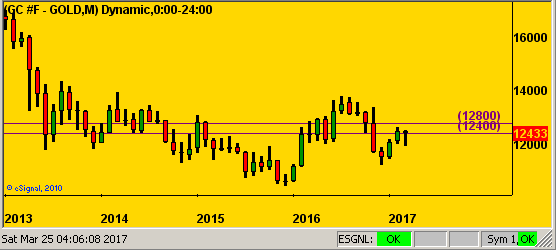
There have been 961 trading days since 20 June 2013 upon Gold's sinking sub-1280, well into said long descent. And from that date, Gold's trading range has spanned 388 points, obviously within which is the comparatively narrow 1240-1280 resistance zone. Yet across those 961 trading days-to-date, 251 of them -- indeed an entire year's worth -- have found the price of Gold to trade inside that 40-point resistance zone, as once again is now the case. Cue Jim Nabors: "Back home again, in Indiana..."... or in Gold's case "in Resistança". Here are the monthly bars for Gold across that span, the 1240-1280 resistance zone -- which a year ago we'd hoped had turned to support -- as labeled:
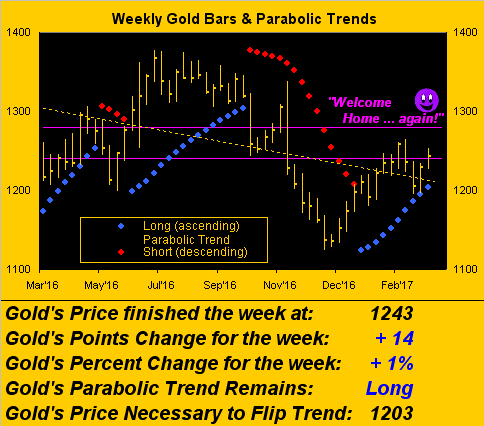
Now paring it down to Gold's weekly bars from a year ago-to-date, price escaped another week of being caught by the still ascending blue parabolic Long trend dots. But as noted last week, Gold is now subject to the squish between those rising dots and the repelling reproach of the purple-bounded 1240-1280 resistance zone ... not exactly a happy home. And as for you parabolic dot counters out there, the average Long trend millennium-to-date is 12 weeks; but since the All-Time High in 2011, the average is 10 weeks, as is now this present run, suggestive that it may soon be done:
So technically, 'tis time for Gold to put price up, or have it shoved down. That said, we fundamentally tip our cap to Forbes contributor Bryan Rich, who in noting the Federal Reserve Bank's being in a bit of a box, sees Gold as a win-win: in his referring to Chair Yellen as being hawkish, (thank you), Gold ought benefit from inflation; but if the Fed's three rate hikes since December 2015 can't be economically sustained (i.e. our seeing negative real rates persist), the economy again becomes wounded (i.e. our seeing an inevitable return to Fed accommodation).
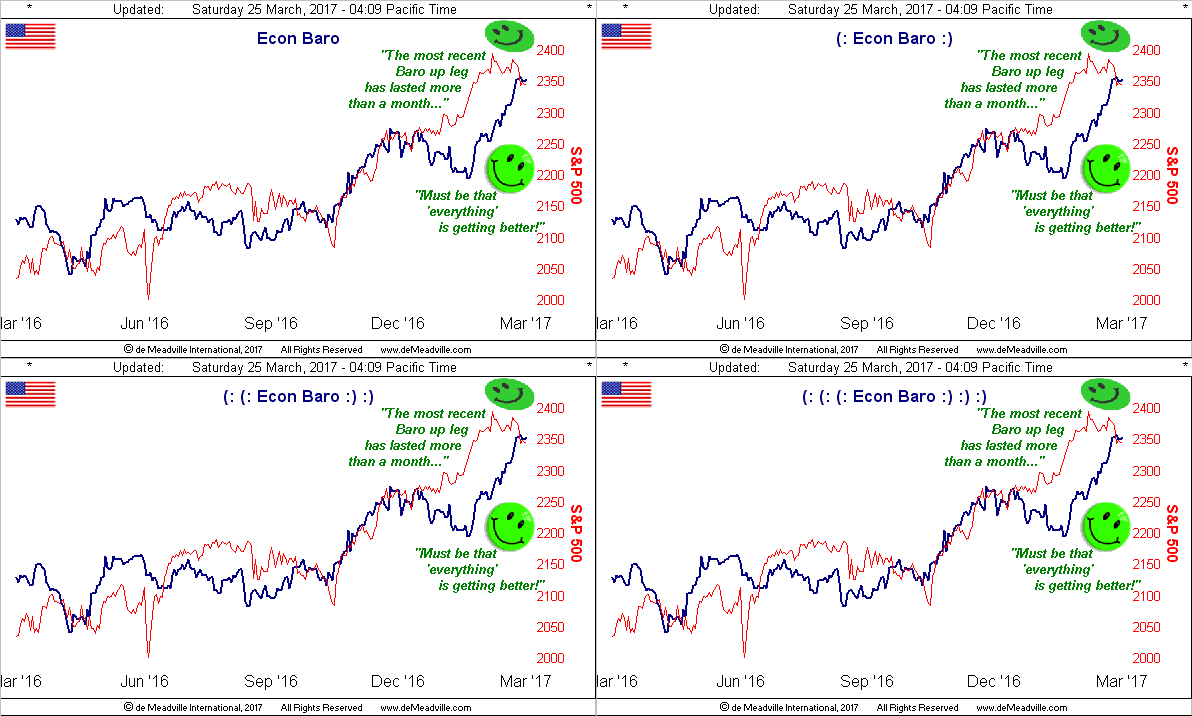
That noted, the Economic Barometer's having recently cycled through more than a full month's period of incoming metrics suggests that, on balance, "everything" is getting better:
But then come those economic elements from "the dark side" that don't really weave their way to the top of the FinMedia's stack. For example, the S&P/Experian Consumer Credit Default Indices released this past week showed bank card defaults having increased in percentage for the fourth consecutive month, along with a rise in the percentage of defaults on first mortgages. Oops. "Tick... tick... tick..."
But for the present, the economic glide remains quite the joy ride, and not just StateSide, but across the pond as well, the EuroZone's economy being described by the venerable Reuters as "sparkling" in citing a Purchasing Managers' Index reading nearing a six-year high. But is the EuroYoyo at the top of its string?
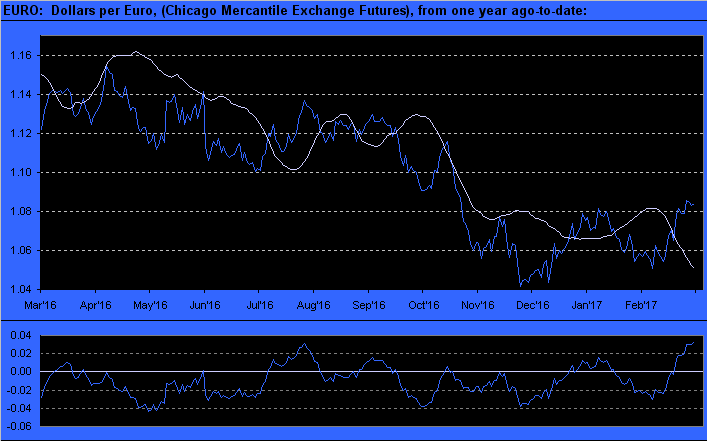
Specific to the currency itself, if you've recently peeked at the website's Market Values page, the euro by our smooth valuation line measure (which tracks price's moves relative to those of the primary BEGOS Markets, i.e. the Bond / Euro / Gold / Oil / S&P), is at quite a high extreme. Here's the year-over-year daily track of the euro with that smooth line, the lower panel showing the difference between the two. And the last time the euro was at this high an extreme (Aug 2016), as you can see, it then stumbled down through the remaining months into year-end, as did the price of Gold fall by some 200 points, (should you need be reminded), so-called "dollar strength" taking the other side of the trade:
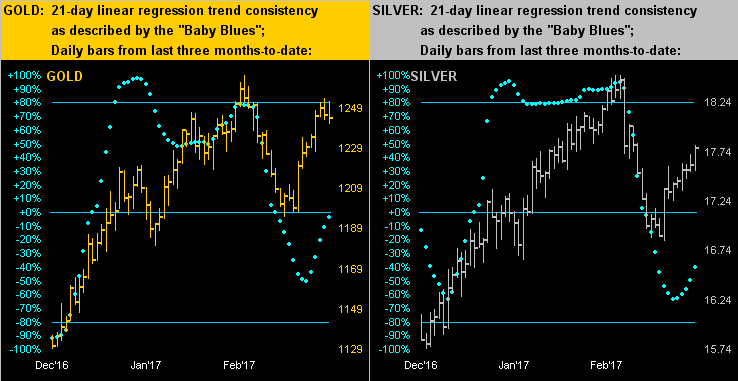
As for the trade of the precious metals over the past three months, we next turn to this two-panel graphic of daily bars for Gold on the left and Silver on the right. And notwithstanding the subject 1240-1280 resistance zone, this picture depicts that "buying on the dip" is in vogue. Normally, the baby blue dots -- which measure the consistency of the markets' 21-day linear regression trends -- shall oscillate from above the +80% level (left axes) down through the -80% level, then back up again and so forth. But this time 'round for both Gold and Silver, the decline of the "Baby Blues" couldn't muster reaching that far down, indicative of buyers anticipating still higher ground:
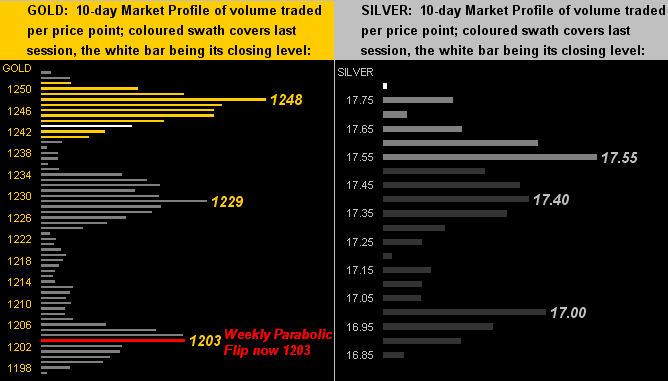
Now let's zoom in on the 10-day Market Profiles. For Gold (left), the levels 1248, 1229 and 1203 show stark as to where the bulk of the contract trading volume has been these last two weeks; note that we've highlighted the 1203 level in red as that is the price above which Gold must stay through these next five trading days in order to avoid tripping the weekly Parabolic trend from Long to Short; (if not tripped this coming week, that level ought then move up to about 1210). As for Sister Silver (right), she finished out the week at the very top of her Profile per the wee white nub; (for those of your fortunate to be scoring at home, Silver's weekly parabolic flip level to Short is below the chart's scaling at 16.66):
So there Gold is, back home again from where so often 'tis been. In fairly short order, price to the parabolic either falls prey, else scampers up and away. Heaven forbid we but delay and again get stuck in the 1240-1280 resistance zone day after day. For 'tis happened before, dare we say, in stints from at least two weeks to better than a month nine mutually exclusive times since that dreaded June of 2013. As sang James Marshall Hendrix, "There must be some kind of way out of here" for indeed at this resistance zone, there's too much confusion.
Speaking of confusion, we'll leave you with these few FinMedia stock market comments from the past week, (bearing in mind that Bob Shiller's "CAPE" for the S&P is presently 28.9x whilst our "live" S&P price/earnings ratio is 34.0x):
■ CNBC has determined that "A record number of investors think this market is overvalued"; no kidding.
■ The FinTimes, contrarily told us that "Stocks aren’t overvalued — so keep buying"; total buffoonery.
■ But taking the cake was Tuesday's top-of-the-hour CNN-fed/Cumulus Media radio news report of the stock market having suffered a "massive selloff, the Dow Jones Industrials falling 237 points". Why, that's -1.1%. "Massive"? Really? What shall be the adjective for -10.1%? Don't think it ain't comin'.
To which end -- to quote the late, great Richard Russell again -- "There's not a bad time to buy Gold."