Gold is hammering on crucial resistance. This has been going on for a while now. A breakout will happen – sooner or later.
Kudos to the gold bugs, they are at it again.
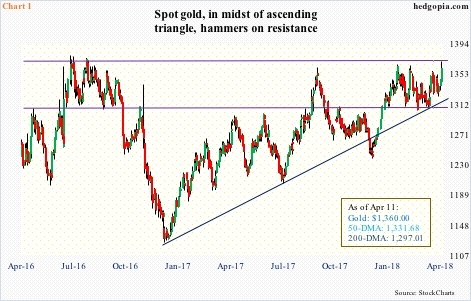
Once again, they are hammering on resistance that has been in place since July 2016 (Chart 1). The latest salvo came after they defended $1,300/ounce three weeks ago. This support goes back to September 2010. Resistance lies at $1,360-70.
Wednesday, gold rallied 1.1 percent to $1,360. In fact, intraday it rose as high as $1,369.40, before backing off, leaving behind a little bit of a tail. It is also right at the daily upper Bollinger band.
The 50-day ($1,331.68) lies underneath.
Gold benefited from some fundamental tailwinds this week. President Trump’s Wednesday warning to Russia that it should get ready for a missile strike on Syria probably contributed to a risk-off feeling among market participants. There were also media reports that he discussed firing Deputy Attorney General Rod Rosenstein.
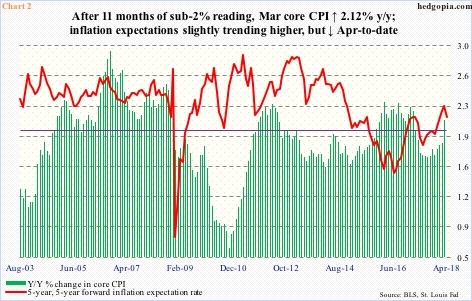
Also Wednesday, the consumer price index for March was released. Prices rose more than expected. Core CPI in the 12 months to March increased 2.12 percent (Chart 2). This was the first reading with a two handle in a year. (That said, core PCE – the Fed’s favorite measure of consumer inflation – has not crossed that threshold since May 2012. In February, it rose 1.6 percent.)
Inflation expectations – represented by the five-year, five-year forward inflation expectation rate – have been trending higher since July 2016, with two-plus readings since last December. Even here, April-to-date is down.
It is too soon to conclude there has been a material shift in inflation expectations or inflation itself. Time will tell if the current uptick in inflation is cyclical or structural in nature. As things stand, the yellow metal might need help from other sources. And they are present.
Non-commercials are hanging in there.
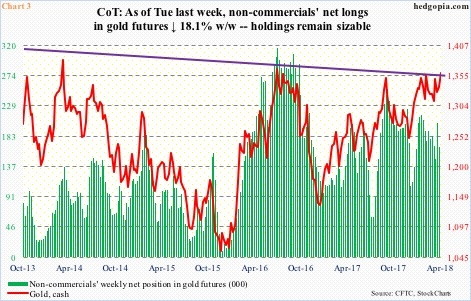
In the week to Tuesday last week, they reduced net longs in gold futures by 18.1 percent to 166,589 contracts, but these are still sizable holdings. Most recently, the cash bottomed on December 12 last year at $1,238.30. In the futures market, non-commercials’ net longs bottomed in the week ended that session.
Their holdings are worth watching. As Chart 3 shows, the green bars and the red line tend to move closely together.
Gold likely also benefited from short squeeze.
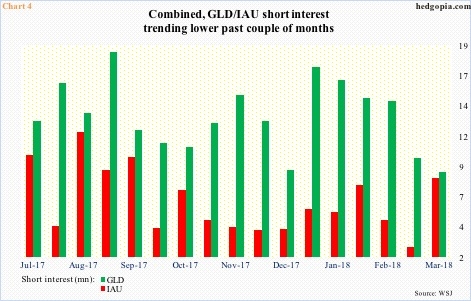
Chart 4 presents short interest on both SPDR Gold Shares (NYSE:GLD) (SPDR gold ETF) and iShares Gold (NYSE:IAU) (iShares gold trust). Assets-wise, GLD is three times as large – $37.3 billion versus $12.2 billion. Performance-wise, they of course follow each other.
In keeping with gold, they bottomed early December last year. GLD short interest in particular peaked mid-January and has been cut in half.
Of late, flows have cooperated as well. Since mid-March through this Tuesday, IAU took in $607 million and GLD $1.1 billion (courtesy of ETF.com).
Over the last several months, all these factors have combined to exert an upward pressure on the metal. The question is, is it sustainable?
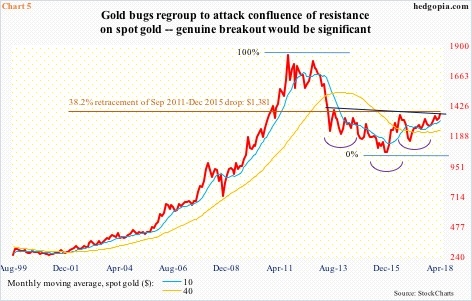
The bulls have done a commendable job of rallying the metal to a confluence of resistance (Chart 5).
A multi-year inverse-head-and-shoulders pattern can be seen in Chart 5. The neckline also approximates Fibonacci resistance. Gold peaked in September 2011 at $1,923.70 and bottomed in December 2015 at $1,045.40. A 38.2-percent retracement of this decline lies at $1,380.91.
Concurrently, it has made higher lows since December 2015, facing resistance at the afore-mentioned $1,360-70. The resultant ascending triangle will be quite bullish if broken.
Hence the significance of where gold finds itself in right now. It is sitting at/right under major resistance area. A breakout – should one occur – would not only confirm the metal’s uptrend but also that sentiment has shifted toward risk-off.
The bulls have been hammering on this resistance for a while now. The more this goes on, the higher the odds that the ceiling eventually gives way. A breakout will happen sooner or later – if not right away, then some other time.
Thanks for reading!

