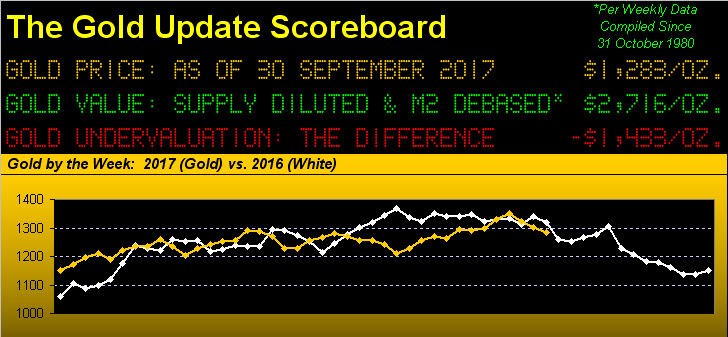
Tis a bit early to begin crooning the mid-20th century yuletide pop tune "It's beginning to look a lot like Christmas" --(Meredith Willson, '51); but a glance at the above track of Gold year-to-date gives the impression that 2017 is pretty much a "pick up the needle" and play 2016 reprise.
Still, with three-fourths of 2017 already in the books, were we now at year-end, Gold's being up 11.3% would rank as its best annual net performance since 2010's gain of 29.7%. Moreover, in having survived (barely) a septic September, Gold remains in the upper echelon of double-digit gainers through Q3, which sadly for Silver is not the case as you can below see in our year-to-date BEGOS Markets standings:
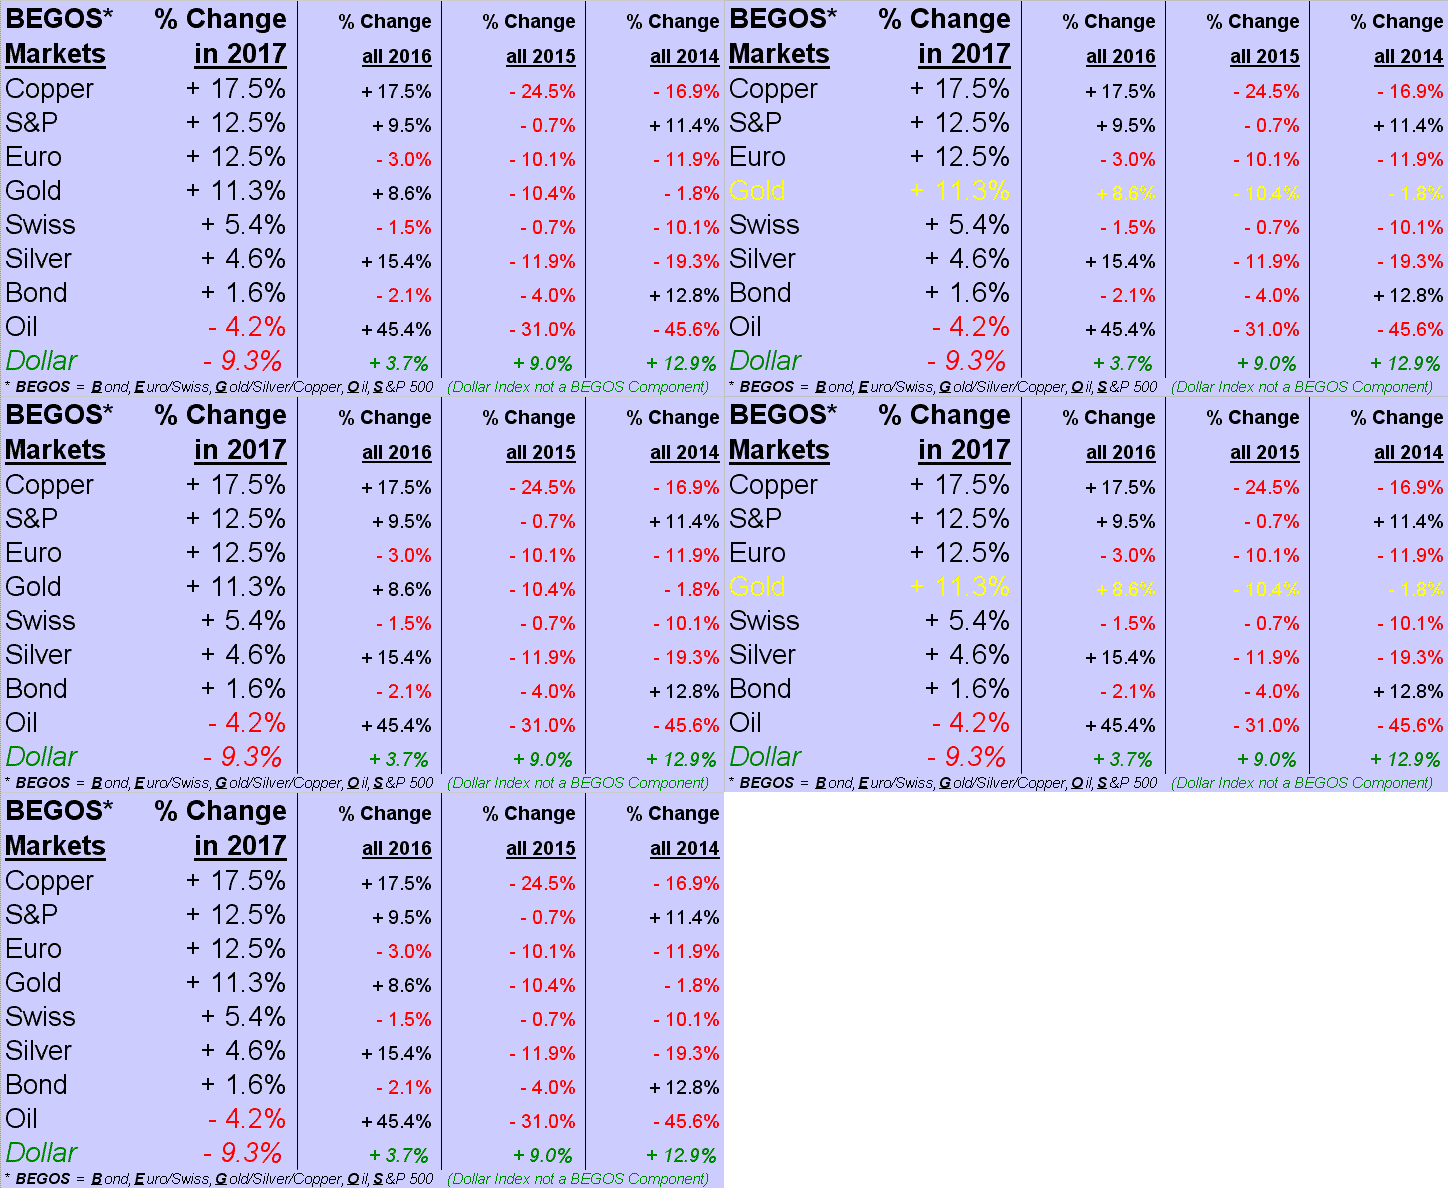
Indeed, the above table shows quite a bit of "conventional wisdom disconnect": both Gold and the stock market as measured by the S&P 500 are up by almost identical amounts? That's not supposed to happen. Copper is flying, yet Oil is dying? Has that ever happened? The Oil/Copper ratio (17.5x) just came off its lowest reading in over 21 years.
But then look again at Sister Silver: with King Gold still nicely up for the year and Cousin Copper soaring, should not the white metal in all her precious and industrial metal glory be at the top of the heap? The Gold/Silver ratio at present is 76.8x which is 22.7% above the millennium-to-date average of 62.6x. So much mis-direction amongst the BEGOS Markets! 'Tis worthy of repeating one of our favourite quotes from back in the day when the NFL was about playing football: "What the hell's goin' on out there???" — (Vince Lombardi).
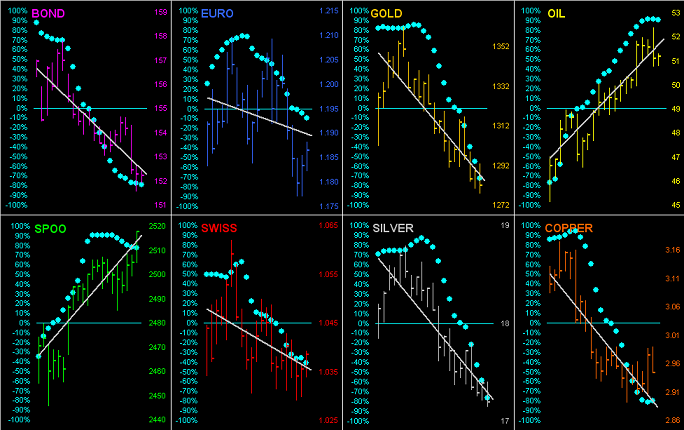
Graphically, here's the entire bunch from a month ago-to-date, the consistency of the linear regression trendlines denoted by those baby blue dots. In anticipating a week ago that the "Baby Blues" had further to fall for both Gold and Silver, hopefully such descent shall quickly relent. But October is not always a friendly month for the precious metals:
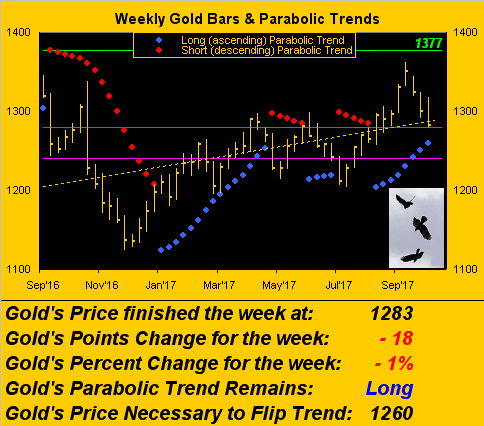
Next as we turn toward Gold's weekly bars from a year ago-to-date, we still think the overall picture looks healthy. As noted, September wasn't pretty, but as written a week ago: "...further to ... 'price bunching' support, we've also same within those otherwise 'Whiny 1290s' as well as with the top of the purple-bounded 1280-1240 box..." And 'tis atop said box where Gold now sits, having closed out the week Friday at 1283.
Now here's the critical bit: time and again over the past four years, we'd love it when Gold would work its way up to this area, only to then disappoint us and retreat. But today we see the tables as turned, our notion being that this area of former resistance has morphed into one of support. Certain technicians may view these last few weeks as "three black crows": that about which we hope to soon be crowing is Gold's turning back higher for the run to Base Camp 1377. But again, the seasonal vicissitudes of October may have to be navigated. Here are the bars:
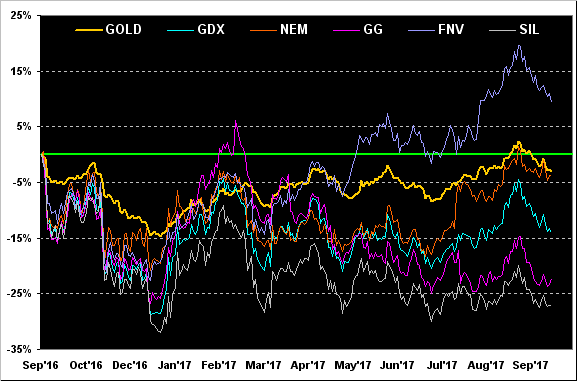
Next in, still measuring from this time a year ago, we see that (with one exception) Gold and several of its precious metal equities brethren are lower: Franco-Nevada (NYSE:FNV) is +9%, however Gold itself is -3%, Newmont Mining (NYSE:NEM) is -4%, the VanEck Vectors Gold Miners exchange-traded fund (NYSE:GDX) is -14%, Goldcorp (NYSE:GG) is -22%, and the Global X Silver Miners exchange-traded fund (NYSE:SIL) is -27%. 'Course year-to-date, all of these entities (save for GG) are higher following a horrid Q4 in closing out 2016. Let's not "pick up the needle" to again play that tune:
As for the irony whereby "they" measure the economy, how did that slowing in August's Personal Income and Spending, along with further shrinkage in Pending Home Sales work out for ya? Your vote by the decline in September's Consumer Confidence is a pretty good answer. Nothin' like being right in sync with reality. Here's the Baro:
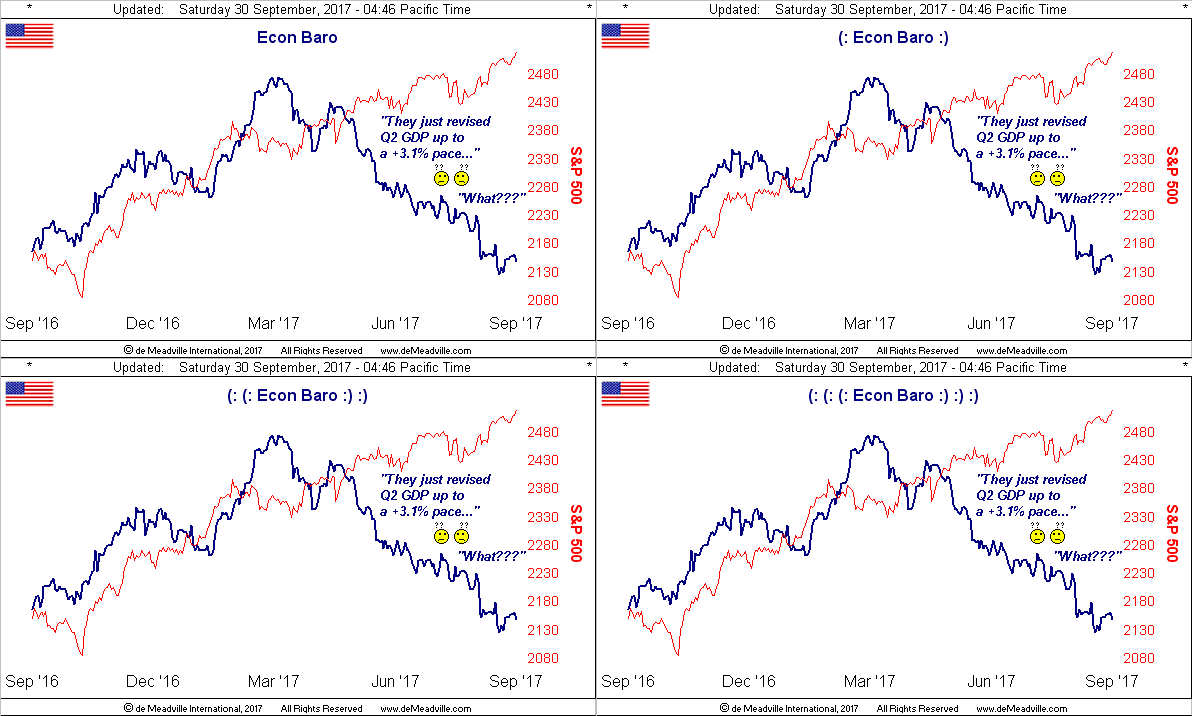
More to the point, have you as yet screamed "Abort!" and abandoned the stock market? After giving us all a scare last Monday, the S&P 500 then managed to recover and even add a few more points to its pile. But the Index closed out its third narrowest September trading range ... just 3% ... since at least 1970, (as far back as our data goes). Moreover, save for a loss of less than one li'l ole point for March, the S&P has not had a losing month since last October. (Oops, sorry, bad word, "October").
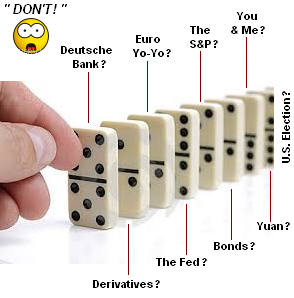
'Course "bad" is often "good" for Gold. Beyond the fact that Gold is trading at half its currency debasement value, we were reminded this past week of the cavalcade of catastrophes that ought well work in favour of the yellow metal. For example, did you happen to catch Fitch having just downgraded Deutsche Bank's (NYSE:DB) long-term credit grade to BBB+, (aka "three levels above 'junk'")? We tend to notice little things like that. Especially when they're a tile in our dominoes set, (as if you need be reminded):
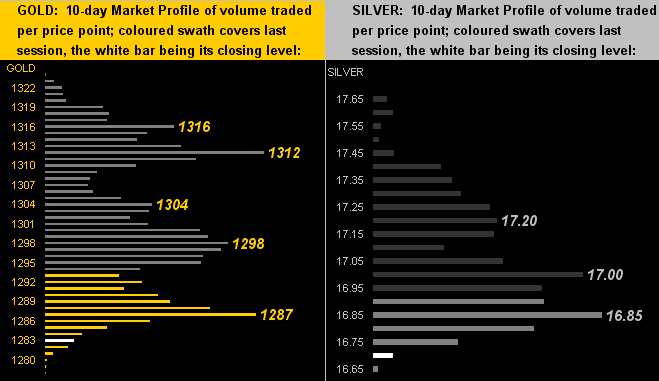
For the near-term trader, the 10-day Market Profiles clearly show the overhead resistance rows that one must hoe toward getting on with the show for Gold on the left and Silver on the right. More broadly as stated, Octobers in general are not very kind to the precious metals. In the 17 years back through 2000, Gold has suffered 10 losing Octobers, including four of the last five. But as dear old Dad used to say, "Ya gotta take 'em one day at a time." Why even the Chicago Cubs suffered many-a-miserable October only to eventually win the World Series a year ago. So let's "Batter up!" out there:
Finally it being month's end, here again is our Gold Structure graphic. Clearly Gold is making positive progress through its ebb and flow since December 2015's low. Still, as we ad nausea repeat , 'tis all about getting back up to Base Camp 1377, staying above that level, and then launching on to higher strata:
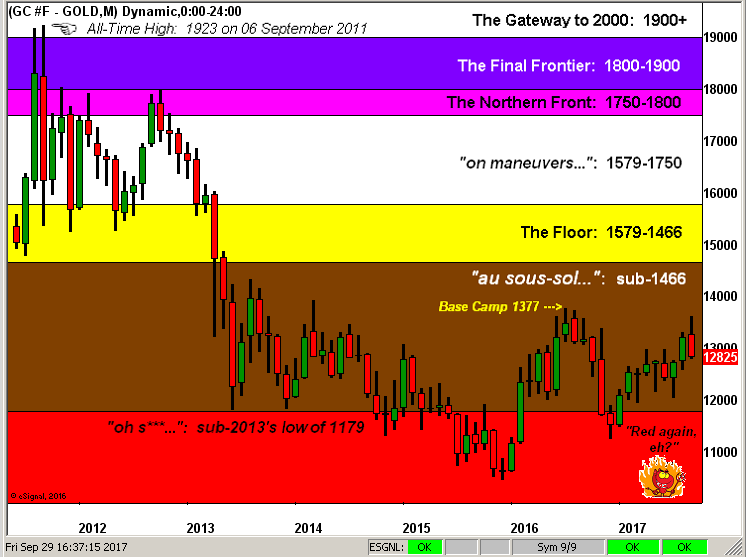
So there 'tis: three quarters down and one to go. And hardly shall Q4 start with a whimper given we've 16 metrics hitting the Economic Barometer through the first week of October, including what is expected to be severe slippage in September job creation given hurricanes Harvey, Irma and Maria. So keep those seat belts fastened.
Speaking of cinched, we'll leave you with this: the good folks over at Qatar Airways are now sporting double beds in business class, which naturally brings to mind the notion of privacy, albeit said beds are described as being "enclosed". Nonetheless, we're envisioning aisle signs which read "In passing, head up and eyes straight ahead please." At present, the beds are only in use on the Doha-London route, which we find rather curious as 'tis but a seven-hour flight: following cocktails, dinner, a film and a stretch, why, 'tis practically time to land. But then again, one ought account for the Mile High Club in taking their pleasure when they can. Either way, we suggest pleasuring one's wealth by tucking in with some Gold: now that's first class, baby!