Get 40% Off
👀 👁 🧿 All eyes on Biogen, up +4,56% after posting earnings. Our AI picked it in March 2024.
Which stocks will surge next?
Unlock AI-picked Stocks

Gold And NZD/USD Analysis For April 19, 2018

Published 04/19/2018, 06:26 AM
Updated 03/21/2024, 07:45 AM

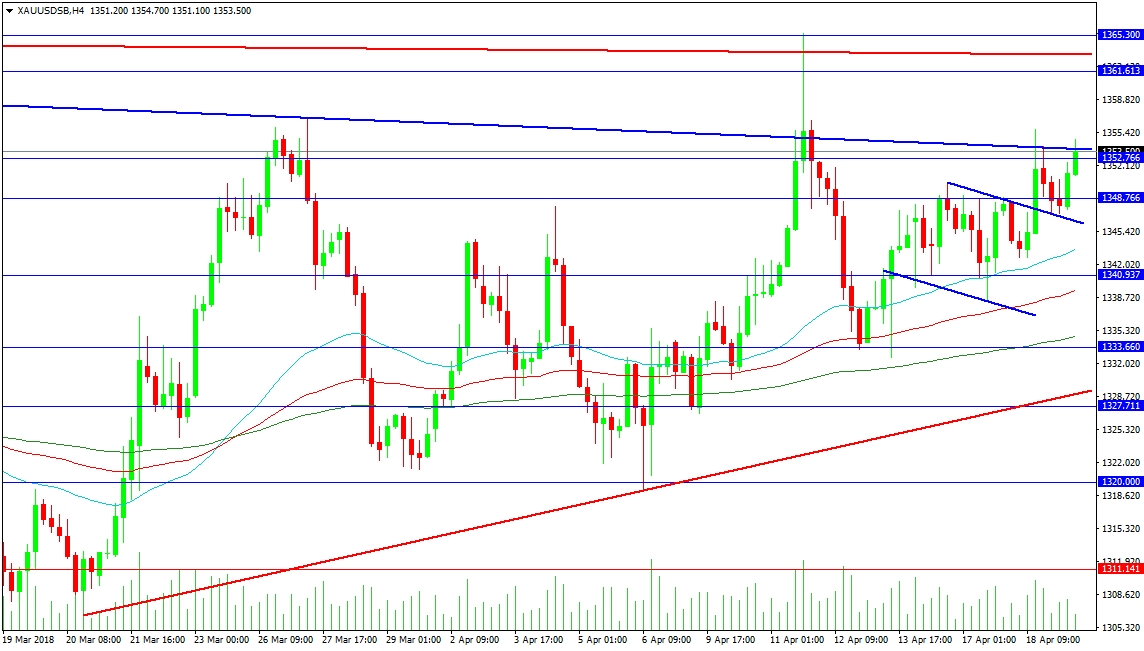
The commodities block has been rising, with oil and metals leading the way. Gold has tested its down trend line resistance again at 1354.00, with a close above this level targeting resistance around 1365.30. The creation of higher lows strongly reinforces this move but caution must be taken that the market doesn’t enter a sideways pattern. A move above resistance leads to 1370.00, followed by 1378.00 and 1390.00. The 1400.00 area remains a target gold bulls will relish achieving but focus will soon shift to higher levels at 1435.00 and 1450.00.

Support comes from the trend line at 1346.50, which has been successfully retested after the breakout. The 4-hour 50-period MA is located at 1343.56, with the 100 MA at 1339.40 and the 200 MA at 1334.75 and rising. The 1333.66 level is mildly supported by the rising red trend line at 1328.90, with stronger support close by at 1327.70. The 1320.00 level held up well during the test on the 6th of April, with a drop below targeting 1311.14 and the 1300.00 area, specifically 1302.50.

Gold 4-Hour Chart

NZD/USD

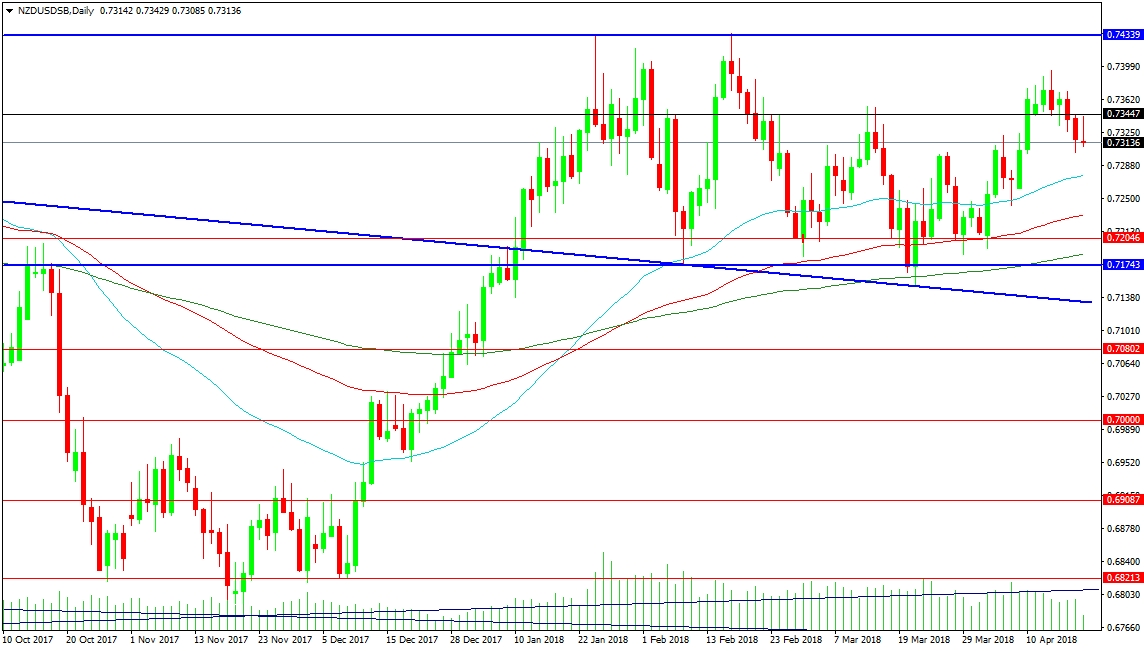
The NZD/USD pair has settled into a trading range between 0.71500 and 0.74340, after breaking above trend line resistance at 0.72000 and successfully retesting said trend line on two occasions since. The upward bias is still present on the chart, with a move above the highs needed to push the market higher. The 0.73447 level is providing resistance at present, with the high at 0.73900 also creating a lower high. It is possible this formation turns into a Bull flag, with a target in the 0.77300 area. A move above resistance at 0.75000 and 0.76240 is needed to reach that area.

3rd party Ad. Not an offer or recommendation by Investing.com. See disclosure here or remove ads .

Support comes in at the 50 DMA at 0.72760, with the 100 DMA at 0.72312 and the 200 DMA at 0.71867. The falling trend line comes in at 0.71330. A move under this line would target resistance at 0.70800, followed by 0.70000 and 0.69087. The lows of late 2017 come in at 0.68213 and 0.67797.

NZDUSD Daily Chart

By Edward Anderson, FxPro Analyst

Latest comments

Nice work Thanks
Risk Disclosure: Trading in financial instruments and/or cryptocurrencies involves high risks including the risk of losing some, or all, of your investment amount, and may not be suitable for all investors. Prices of cryptocurrencies are extremely volatile and may be affected by external factors such as financial, regulatory or political events. Trading on margin increases the financial risks.
Before deciding to trade in financial instrument or cryptocurrencies you should be fully informed of the risks and costs associated with trading the financial markets, carefully consider your investment objectives, level of experience, and risk appetite, and seek professional advice where needed.
Fusion Media would like to remind you that the data contained in this website is not necessarily real-time nor accurate. The data and prices on the website are not necessarily provided by any market or exchange, but may be provided by market makers, and so prices may not be accurate and may differ from the actual price at any given market, meaning prices are indicative and not appropriate for trading purposes. Fusion Media and any provider of the data contained in this website will not accept liability for any loss or damage as a result of your trading, or your reliance on the information contained within this website.
It is prohibited to use, store, reproduce, display, modify, transmit or distribute the data contained in this website without the explicit prior written permission of Fusion Media and/or the data provider. All intellectual property rights are reserved by the providers and/or the exchange providing the data contained in this website.
Fusion Media may be compensated by the advertisers that appear on the website, based on your interaction with the advertisements or advertisers.
© 2007-2024 - Fusion Media Limited. All Rights Reserved.