As sung iconic ABBA "Money money money, must be funny, in a rich man's world". Let's look at but a few measurements of which there are infinite permutations, of "money".
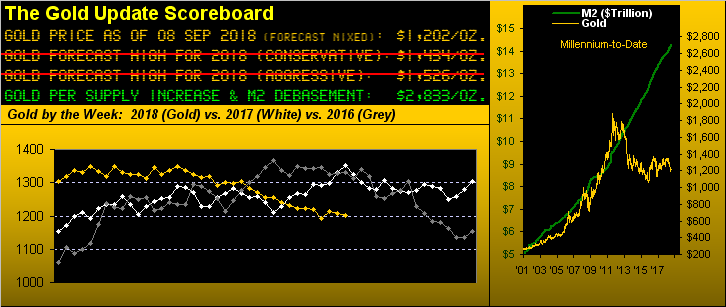
Obviously a mere glance at the above Gold Scoreboard's right hand panel shows us measures of two monies we regularly follow, i.e. the U.S. Dollar money supply (M2) and the price of Gold, which until some seven years ago ceased its naturally moving up in positive correlation with M2 since the turn of the millennium. To be sure, prior to 2001, Gold lagged increases in the Dollar's supply, albeit far less demand was there for the yellow metal as the average Joe could be content with a CD rolling over each year at the bank.
But as with anything, the more of whatever there is, the less 'tis worth per unit, as we've so strikingly seen since 2001 with more and more Dollars and thus less and less rates of interest. Arguably too, one might command higher interest rates as with more Dollars, there's more risk as they become more worthless. Still, rates rising year-to-date are making the Dollar look great, its Index +3.9% in 2018, (and its M2 supply actually +3.2%, but we're not supposed to mention that), whilst Gold is -8.2% (and don't look if you've a weak stomach, Silver is -17.1%).
Dollar strength, indeed. And why not? As well year-to-date, the Turkish Lira has fallen against the Dollar from 26¢ to 16¢ (-38% or from 4/$ to 6/$); the Argentine Peso has fallen against the Dollar from 5.2¢ to 2.7¢ (-48% or from 19/$ to 37/$); oh and lest we forget, the Venezuelan Bolívar has fallen against the Dollar from 9.7¢ to 0.0004¢ (-99% or from 10/$ to 250,000/$).
"But mmb, the combined GDPs of those countries is less than that for Texas, let alone California..."
Now don't wreck all that "Dollar strength" fun going on out there, Squire. Clearly, the Doggie Dollar is getting the bid (rather than is Gold) as there is a modicum from an interest rate to be gained and little panic about it all.
'Course, what's really lost in it all is that the Dollar Index settled the week yesterday (Friday) at 95.380; Gold settled at 1202 ... for nearly two years back at the week settling 30 September 2016 the Dollar Index closed at a like 95.385, but Gold notably higher at 1319. Talk about undervalued by any-and-all measures is poor old Gold!
Then too is the world's ultimate funny money to which we've given the pet name of bits**t, the year-to-date of it -56%. Is it any wonder Goldman Sachs is putting its cryptocurrencies venture on hold? (Say no more, say no more...)
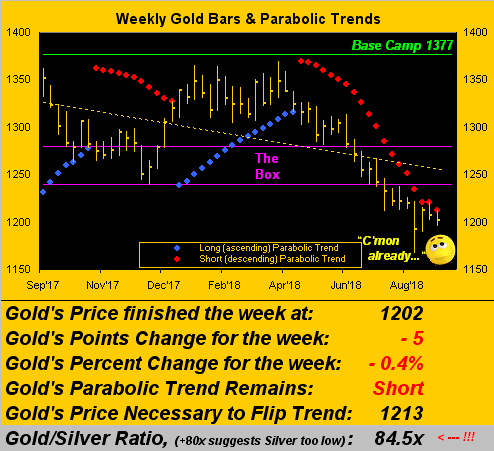
Those of which we wish to see no more are the descending red dots across Gold's weekly bars. The now 19 weeks of parabolic Short trend ranks third in duration millennium-to-date, (the longest one being 31 weeks culminating on 31 May 2013). Price need just trade up through 1213 in the ensuing week to end this trend toward rounding the next upside bend:
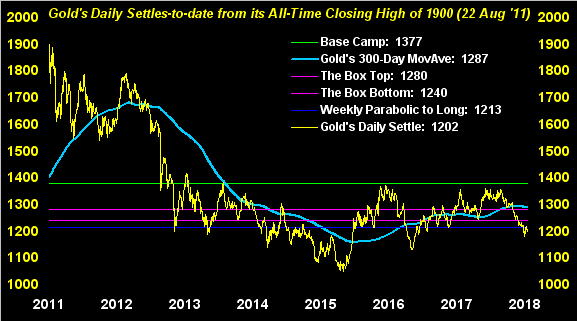
More broadly from the "bad news/good news" perspective we next turn to Gold's daily closes-to-date from the All-Time Closing High (1900) over seven years ago. The bad news is we see the bright blue 300-day moving average line beginning rolling over to the downside. The good news is said average is so ponderously slow vis-à-vis Gold's relatively lickety-split movement -- not to mention price's present deviation below the average -- that contrarily 'tis time to get aboard:
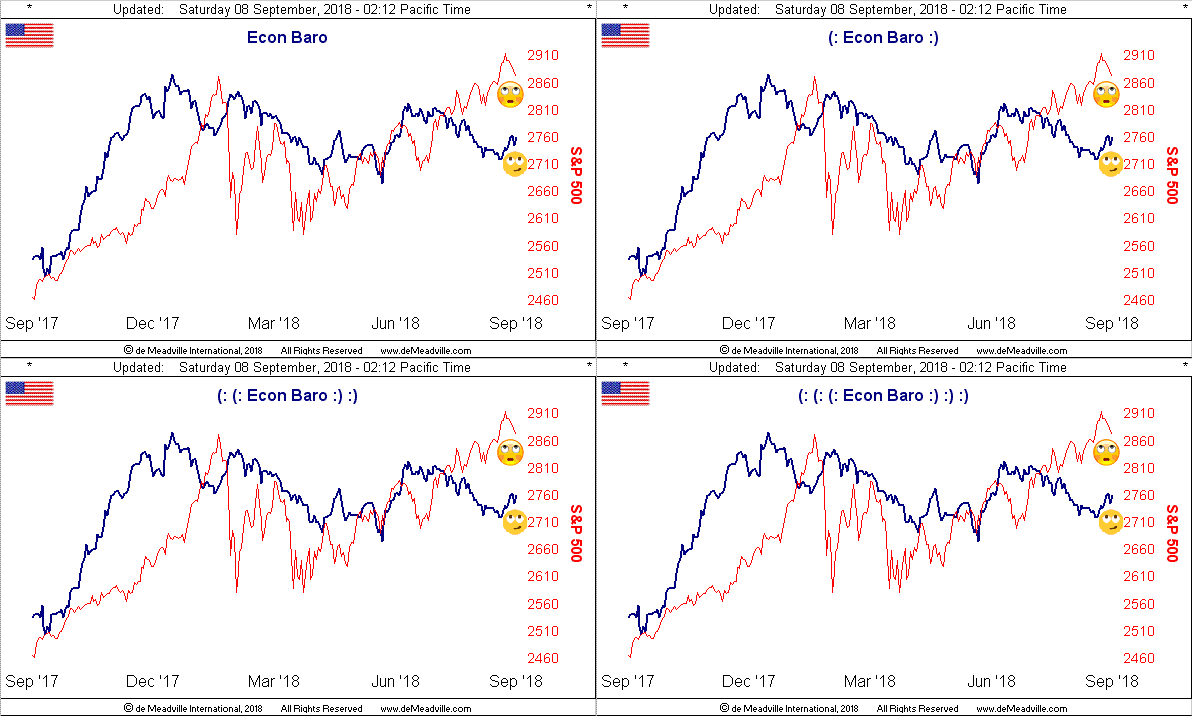
Here's another contrary observation: the Economic Barometer is starting to pick up, yet the stock market as measured by the S&P 500 is starting to blow up ... a rather extreme descriptor perhaps, but overdue beyond belief. Maintaining a "live" price/earnings ratio above 50x "ain't easy, ya know", --(Thelma Ritter, 'Boeing (NYSE:BA) Boeing', Paramount, '65). Nonetheless, the week's incoming metrics for the Baro were fairly good on balance: The Institute for Supply Management showed August improvements in both the manufacturing and services readings; Hourly Earnings increased as did Payrolls, (at least by the Department of Labor Statistics measures but not by those from Automatic Data Processing). Still, Jul's Trade Deficit notably expanded and Factory Orders fell. Here's the whole picture:
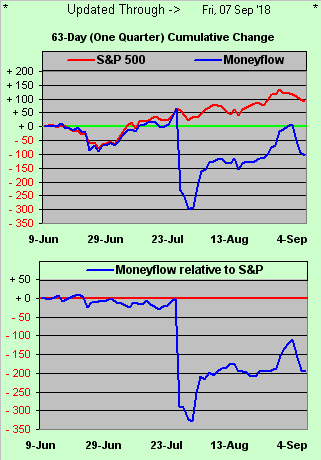
Oh, and then there's this further note with respect to the stock market. Remember back in late July when Facebook (NASDAQ:FB) and Twitter sported whopping consecutive one day losses such that the S&P 500's moneyflow melted down? That's the big El Plungo of the blue line in this next graphic of the S&P's (red line) points change from three months-ago to date. Note that the S&P has since recovered in full and then some ... but not the moneyflow, which itself is regressed into S&P points such that the two lines can be put on the same scale. The bottom line is therefore the bottom panel of the graphic (moneyflow less S&P): it suggests the S&P presently is almost 200 points too high. (You've been warned):
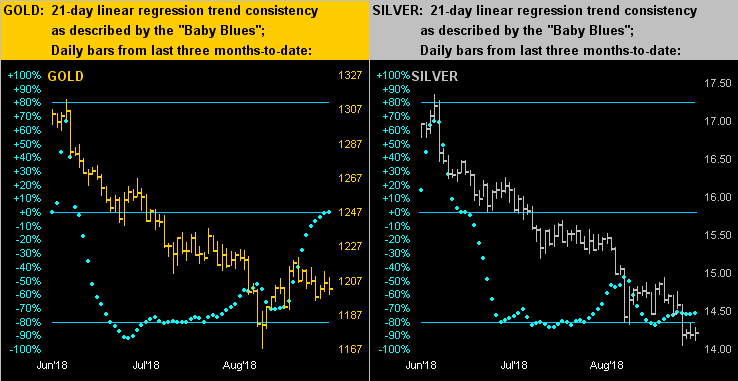
Perhaps not so much warning as insulting are the precious metals' daily bars from three months ago-to-date along with their "Baby Blues" denoting linear regression trend consistency. For Gold on the left, the blue dots are rising, but price is not following (at least not yet, hint hint, nudge nudge, elbow elbow). Sadly however, such is hardly the case for Silver on the right, her complete languishing of price pushing the Gold/Silver ratio (as you no doubt noted earlier in the weekly bars graphic) up to an acute 84.5x!
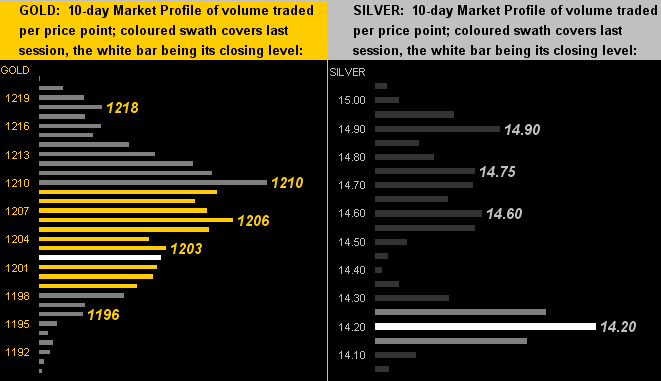
From insult to misery? For the past 13 weeks, Gold has recorded 11 net losses ... Sister Silver 12 net losses. What is it therefore like to be buried in one's 10-day Market Profile? Have a look, Gold at left, Silver at right:
To close, we had the honoured opportunity this past week to be joined by a serious precious metals stacker (of the so-called "monster box") ilk. We spent a good 30 minutes marveling at just how uncanny, dare we say illogical, are the low levels to which we've seen the precious metals go, (the market "never being wrong" notwithstanding). As we wrapped up our talk, the thought came to mind that were the rising young star Alexandria Ocasio-Cortez, (to turn 29 years of age this October), to win the U.S. Presidency in 2024 (for which she'd be eligible at age 35), the price of Gold (if not already there) would accelerate to $3,000/oz. and beyond in a heartbeat. Not a political point: rather a logical ($print$ $print$ $print$) point. Funny money indeed! Got Gold?