First, let's start off this weekend’s update with a reminder that Gold is the ultimate cycle driver across the broader PM complex. Friday’s late afternoon post shows you this and how volatility in the Stock Market can impact Silver and the Miners but If Gold remains bullish, the rest of the sector should eventually follow. For that to play out however, Friday’s lows will likely need to hold. It is time to be careful, however, and the USD will also likely need to roll over early next week to facilitate all this so I will be watching all that closely and providing you with my thoughts via intraday posts.
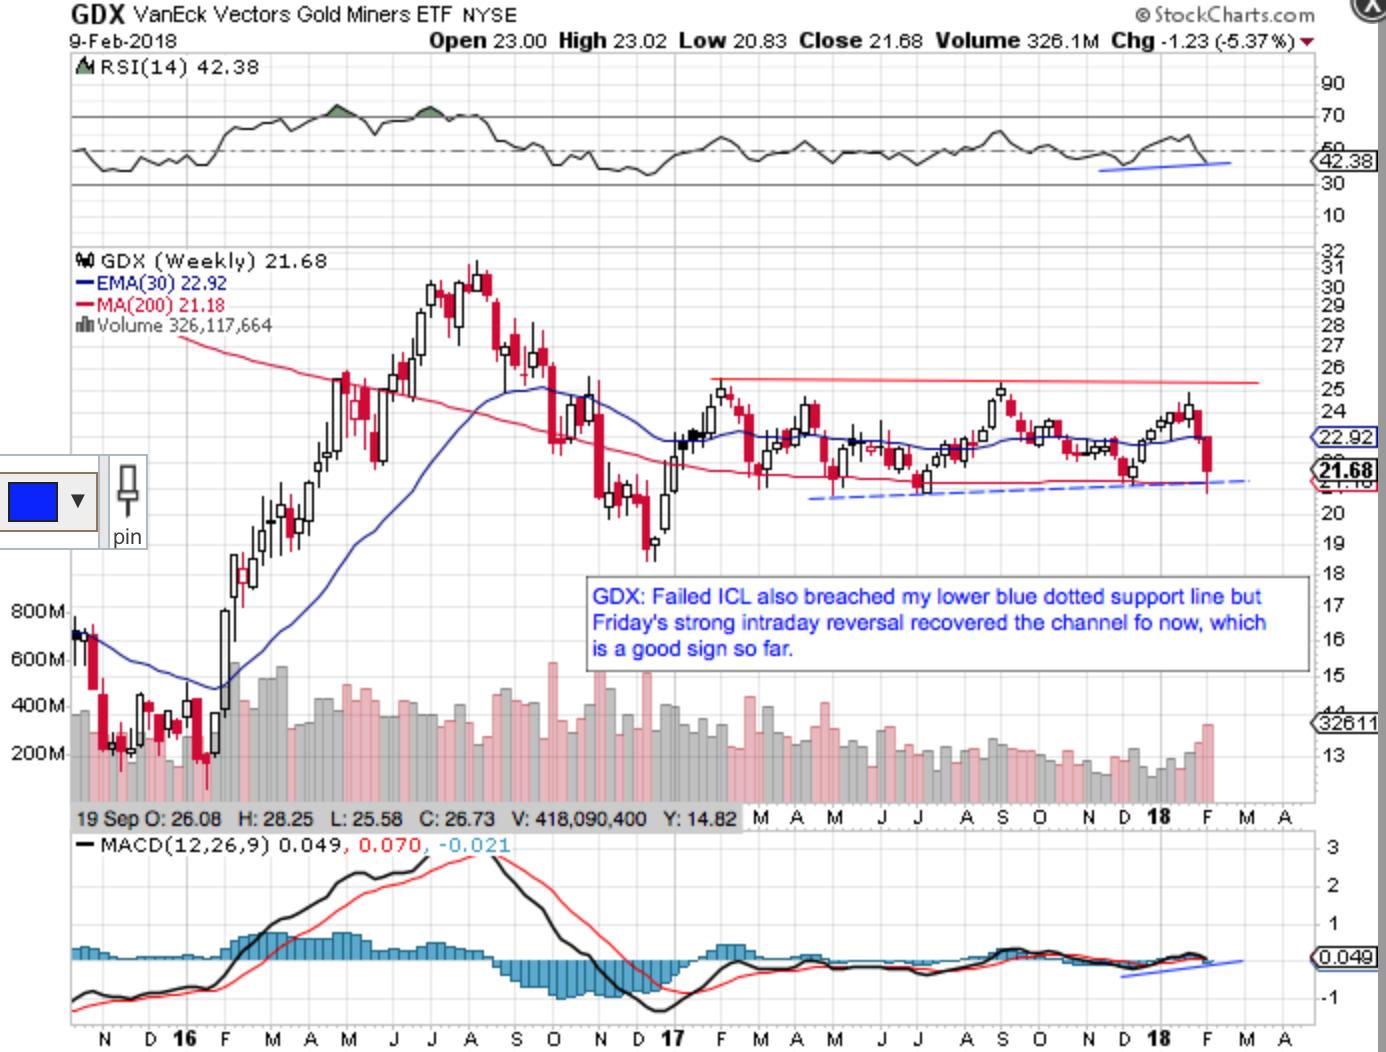
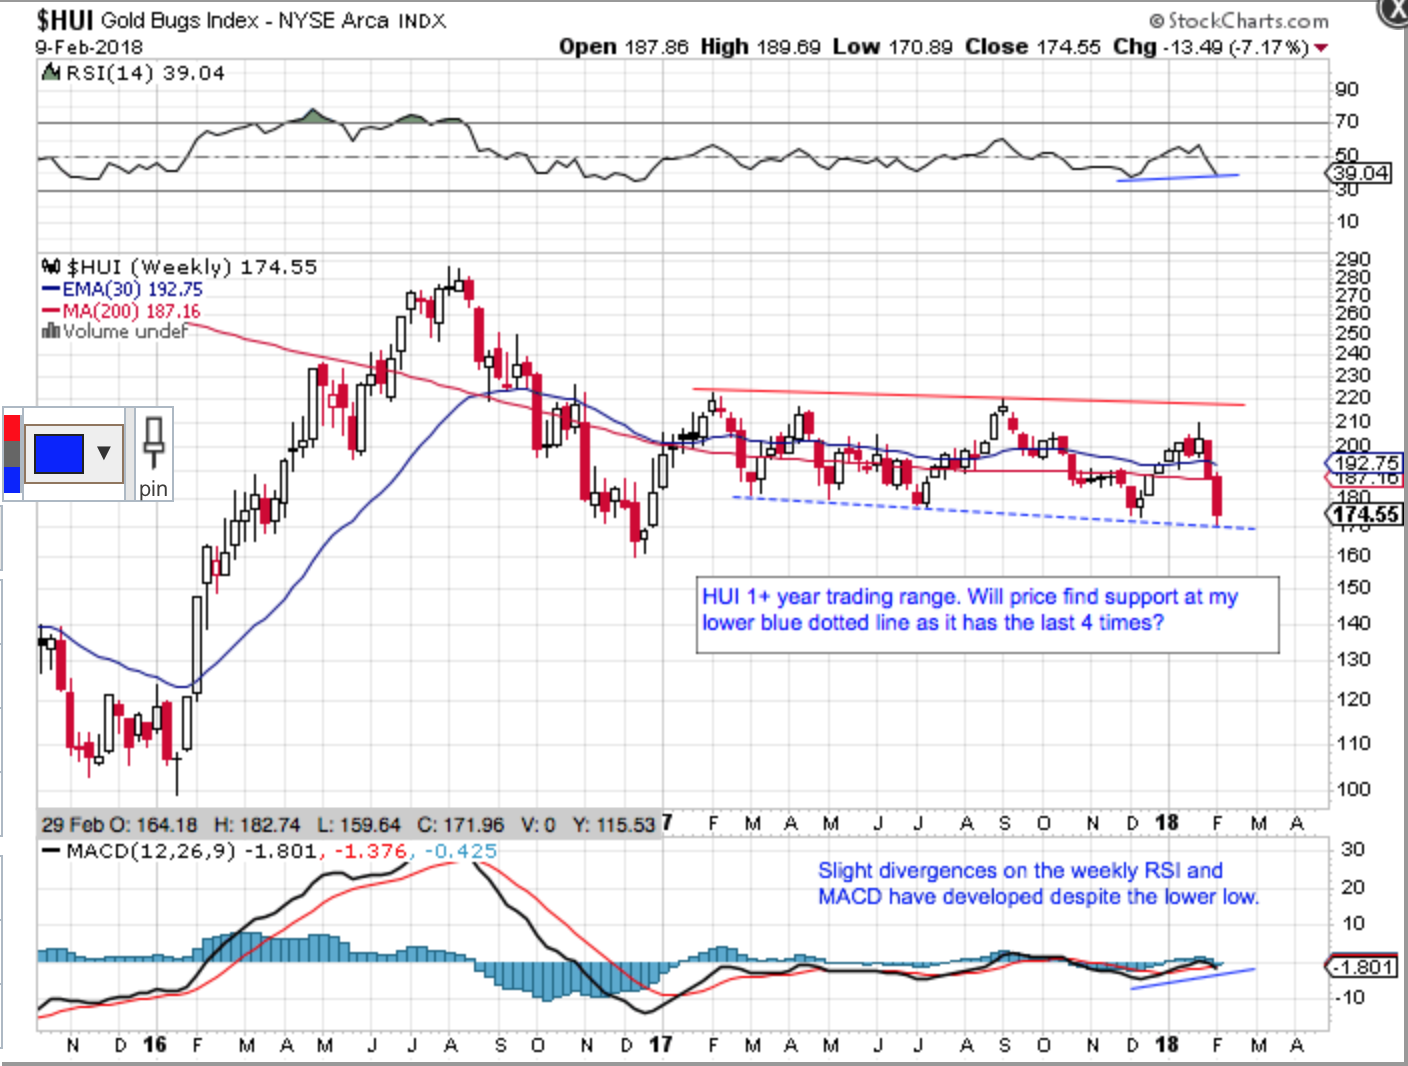
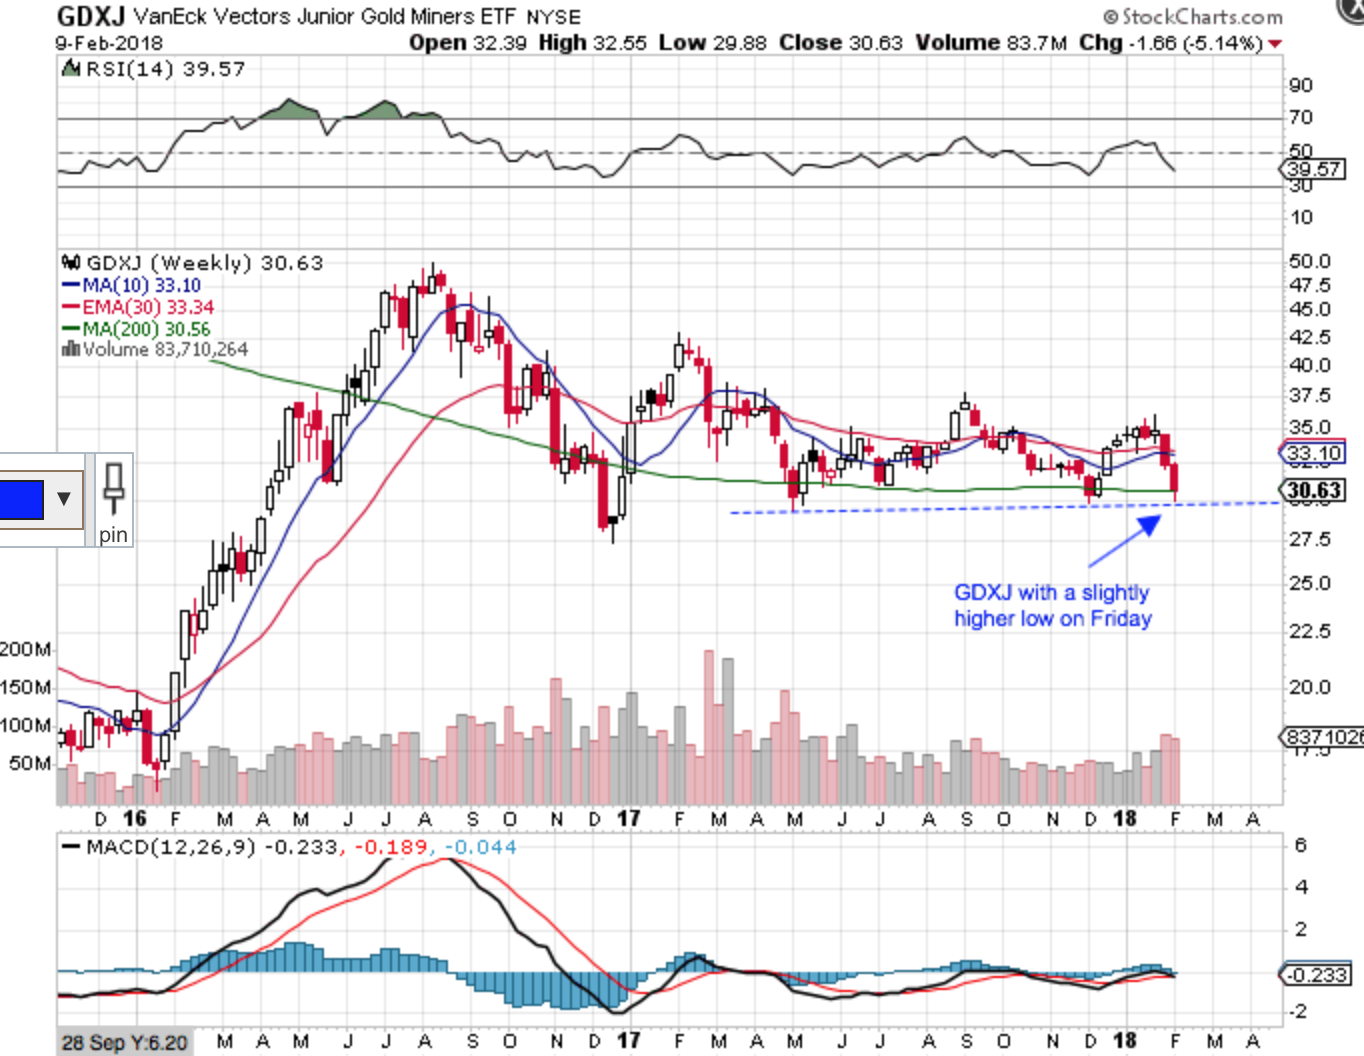
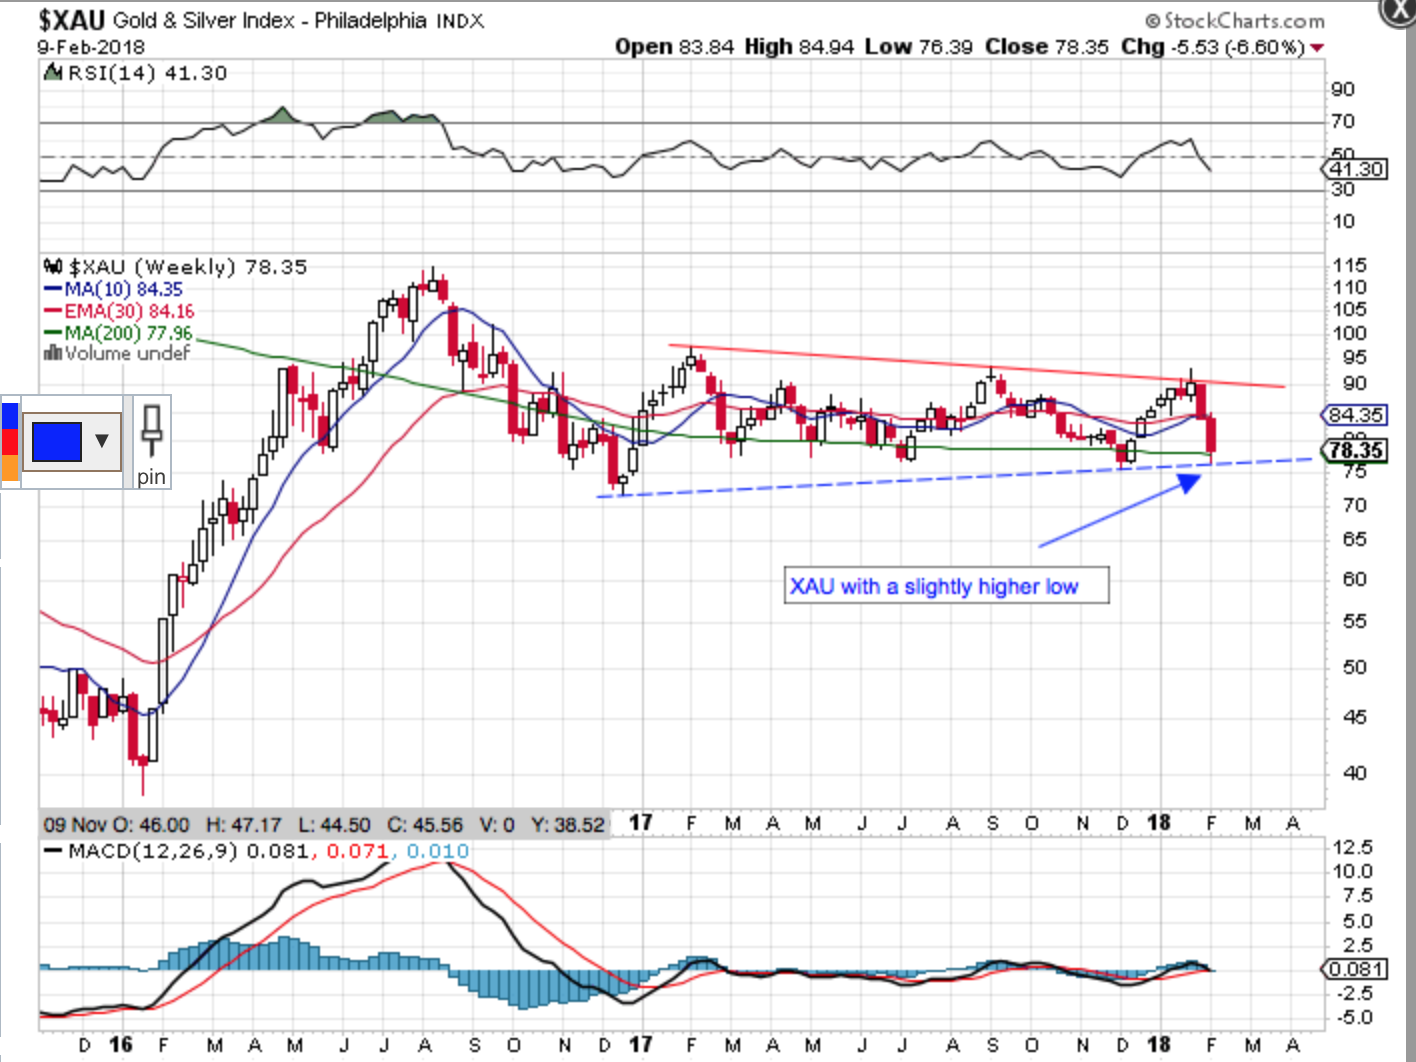
There is no doubt that VanEck Vectors Gold Miners (NYSE:GDX) and the HUI Index had a failed Intermediate Cycle based on Friday’s price action, but the XAU Index and VanEck Vectors Junior Gold Miners (NYSE:GDXJ) did not just yet, which highlights that the mix of miners with the various ETFs and Indexes represents a mixed bag so to speak. My last post also shows you that we have seen this act before, particularly at the early 2016 Jan undercut low by GDX.
Price simply exploded higher almost non-stop for 8 months into Aug 2016 so this shows us that a failed ICL in the Miners is not the end of the world. As I have mentioned many times, Gold is the real Cycle driver across the PM complex and so far, its chart is still very bullish. My first Gold chart is a 1+ year weekly that shows the importance of the 10wma in determining if Gold’s Intermediate Cycle has topped. The 10wma held this week but next week will be crucial, IMO. My second Gold chart is a close up daily showing how it is still very much in a bullish posture. Again, next week is very important.
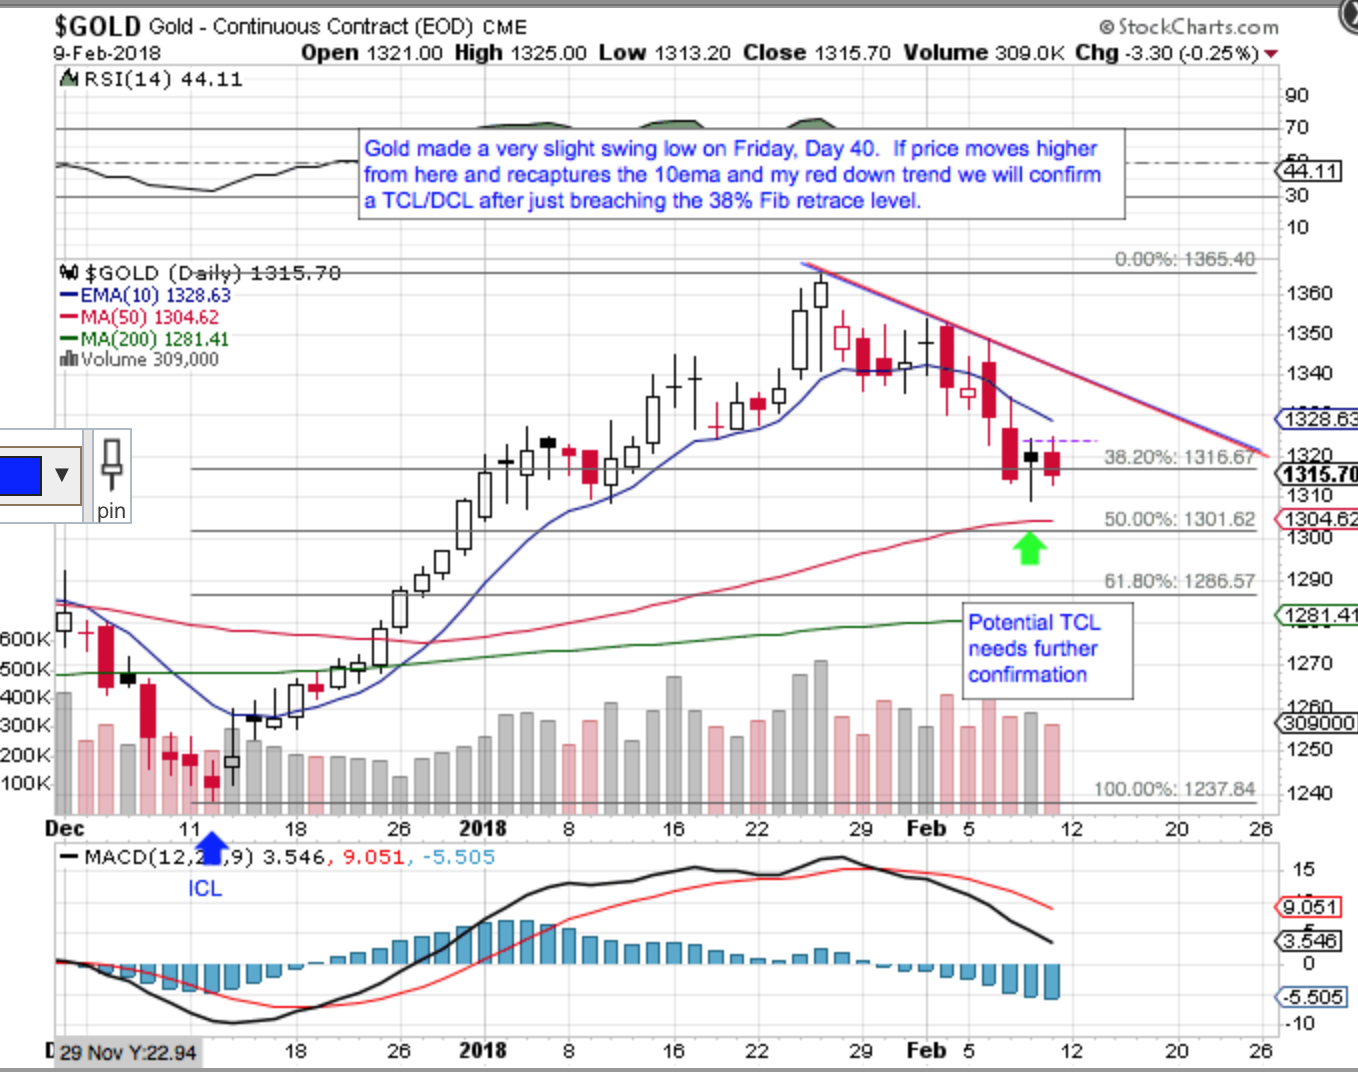
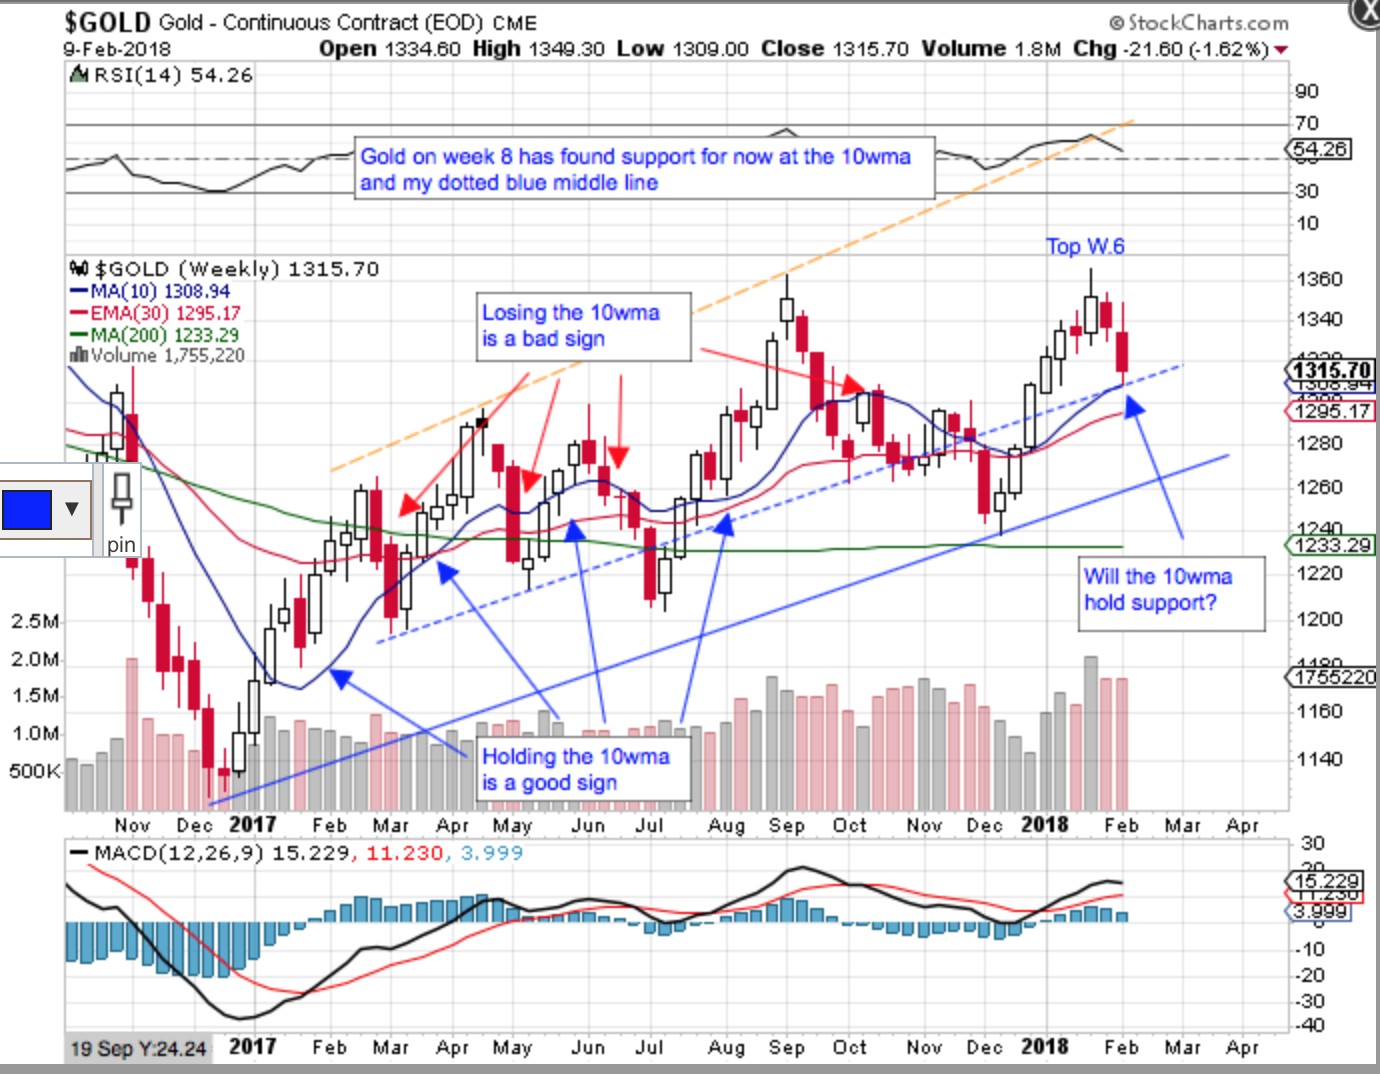
Regarding the Miners, Friday’s very strong reversal near the close was interesting and may signal that this was just a “stop run” undercut low but we won’t really know for sure until next week. I will be watching the price action on the USD, Gold and various PM indexes closely for signs of a bottom. Gold is the key, IMO.
My first set of charts are 2 month Dailies on GDX and the XAU index showing that GDX has a failed Intermediate Cycle while the XAU, so far, has not. Both had strong intraday reversals into the close. GDXJ was also second on the WSJ’s Buying on Weakness report and SPDR Gold Shares (NYSE:GLD) was 7th, I believe.
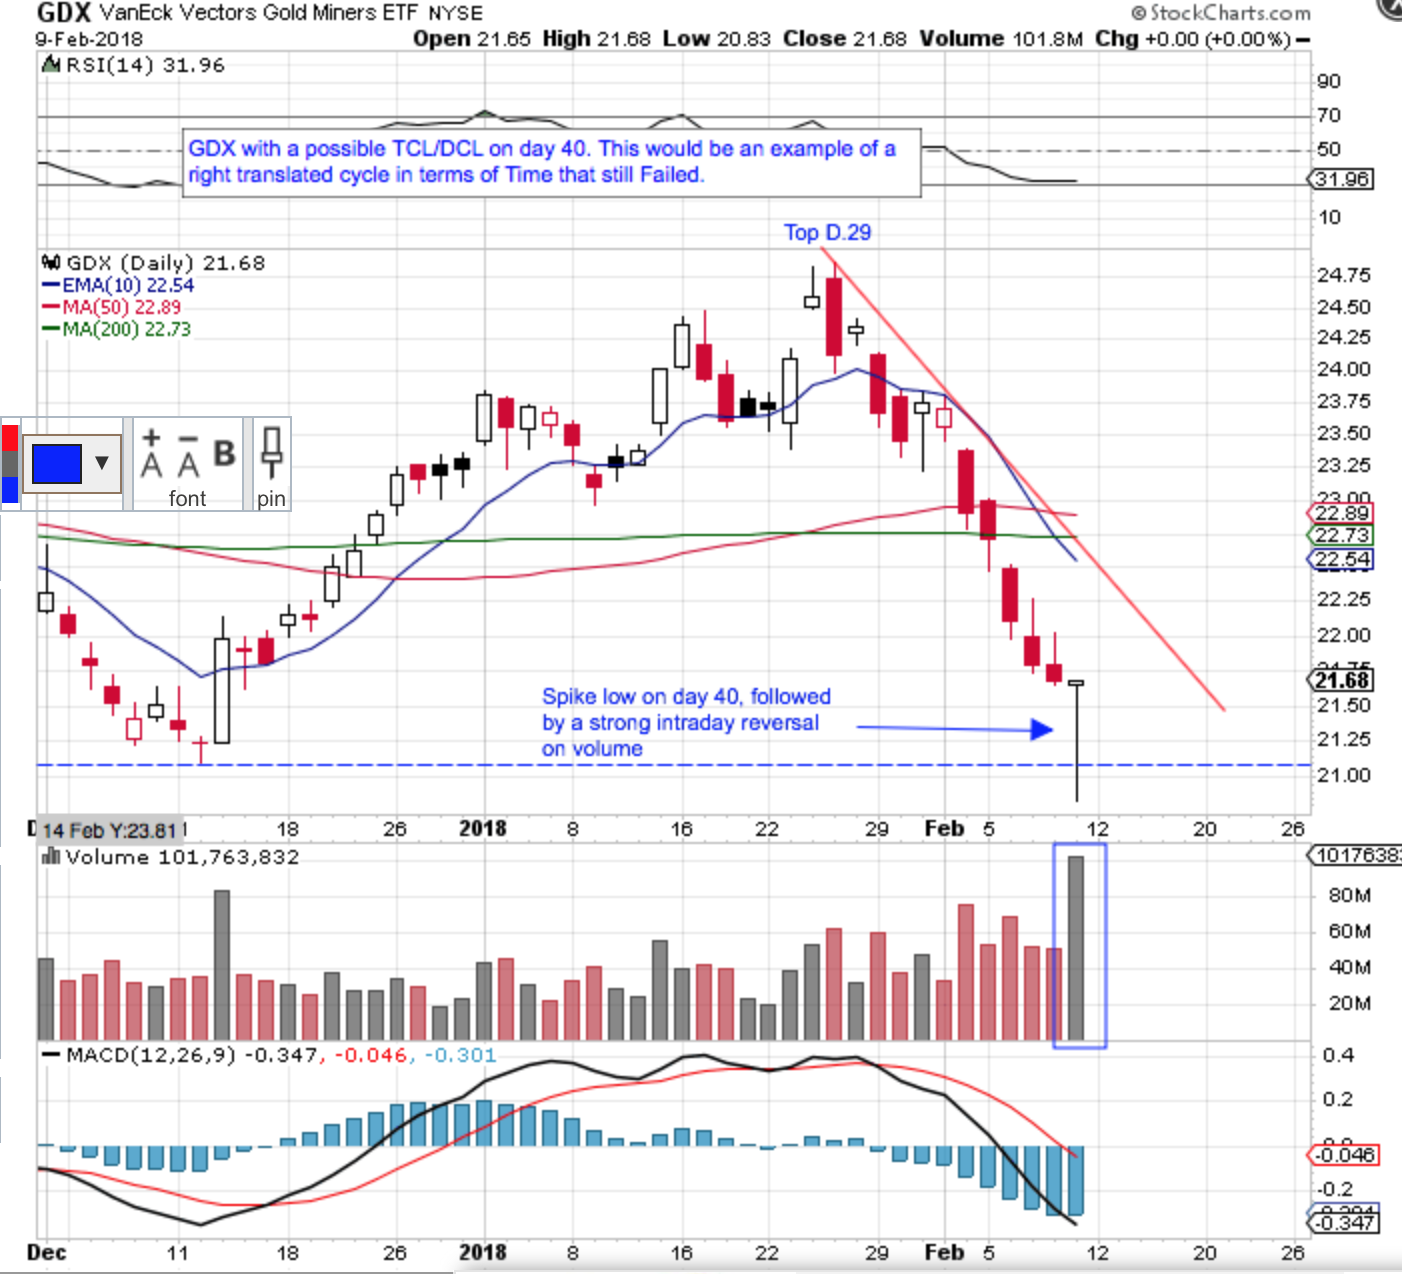
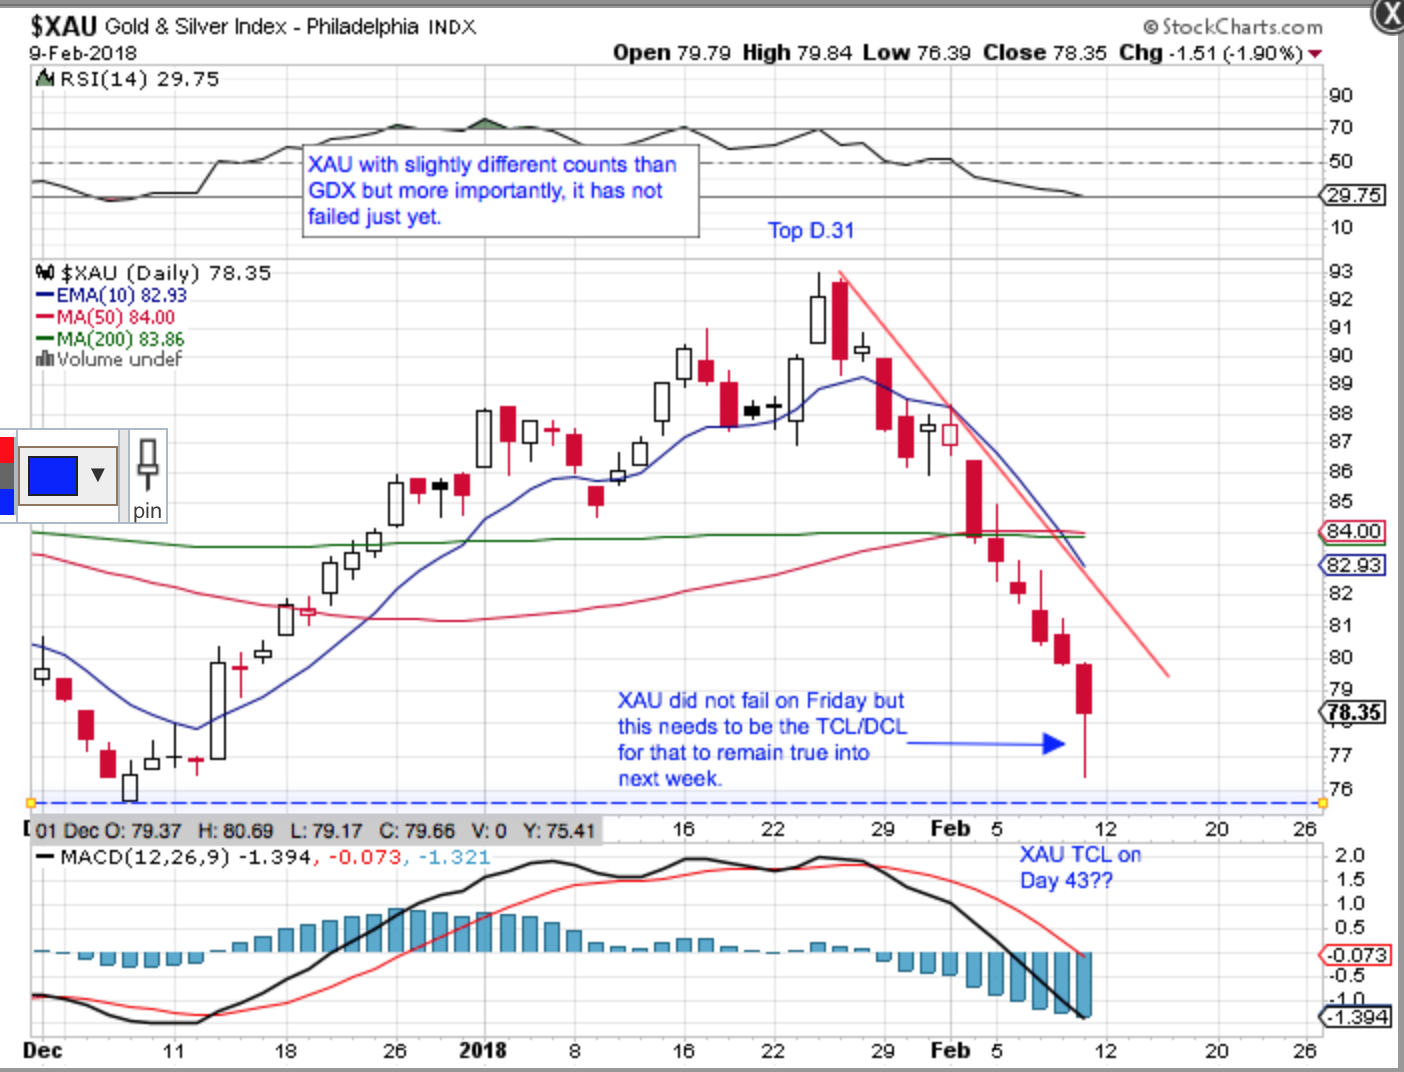
The next set of miner charts are 2+ year weeklies showing where price has found support thus far. So outside of a cycle failure, Price is at critical support. For the charts to remain constructive for more bullish price action, however, these lows need to hold, IMO, and start to bounce next week. If not, the Gold Miner sector could get ugly.
