
Through much of this young year, Gold has basked in its glow of being above where 'twas through much of the same period a year ago -- but now, 'tis not so. Price settled out the week yesterday (Friday) at 1235, which per the above panel is 25 points (-2.0%) below 2016's level nine like weeks into year, (then at 1260). Proof once again that the trend is our friend 'til it reaches the bend, which by Gold's slacking continues to be the repellent, dare we say repugnant, 1240-1280 resistance zone. But as for Sister Silver...
...Ouch! Silver had been on one of those stock market-like "we never go down" binges, pretty much from the 20 December low of 15.675 to the year's high of 18.510 on both this past Tuesday and Wednesday. To be sure, we've been marveling for many-a-week at how Silver's "Baby Blues" have been depicting an almost perfect upside day-by-day consistency of the 21-day linear regression trend. But then came this past Thursday and...
...Crack! went Silver's Blues, price plummeting so swiftly as to hoover back 13 trading days of gains (+ 4.9% since 10 February) by falling 3.7% in less than two hours! Yet 'tis hardly understatement to assert that selling Silver was absolutely due, having previously noted from the precious metal aspect Gold had already come off its own upside rails, and from the industrial metal aspect, Copper had already for some three weeks been flailing about and failing. From left-to-right here are the three metals across the last 21 trading days, with their respective Baby Blues and current grey diagonal trendlines:

Still, have a look at each of the above markets' rightmost bar (yesterday) of recovery. For even with Federal Reserve Bank Vice-Chairman Stanley Fischer's (per his most diplomatic terminology of "If there has been a conscious effort I'm about to join it") jumping on the rate-hike bandwagon, the dovely Chair Yellen nonetheless hedged so as to "evaluate whether employment and inflation are continuing to evolve in line with our expectations". That is to say, her eyes are squarely-focused on the late-arriving February payrolls data due this next Friday (10 March). 'Course, one need take no more than a mere glance at the Economic Barometer to see that it has "rate hike" written all over it:

Moreover as we move into March, in spite of all the ballyhoo over a stock market true ("Yikes!"), 'tis the unspoken-about metals which continue to lead the BEGOS Markets through the first two months (plus three trading days) of 2017, as we go to the current standings, Sister Silver still shining atop the table:

That said, notwithstanding Friday's partial comeback resilience, should Silver reverse into correction mode near-term, how low might be "low"? Why, we can turn to our old pisano Leonardo "Fibonacci" Bonacci, don't you know:

Specific to Gold as we turn to its weekly bars -- which remain in a parabolic Long trend despite having yet again been cast beneath the bus of the purple-bounded 1240-1280 resistance zone -- the price pattern from December on balance is similar to that for Silver such that in correction mode, we'd eye 1200 as the place to hold. Note, too, that the dashed diagonal regression trend line is of late sporting a bit more negative tilt:

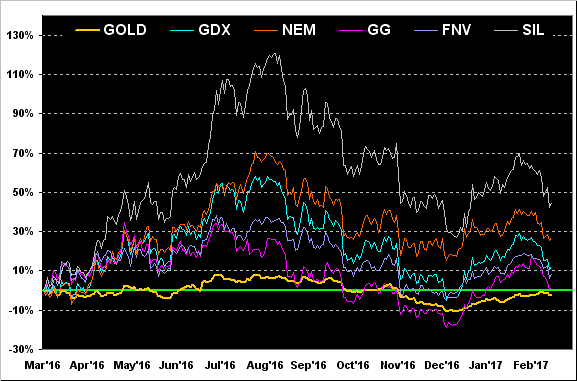
Looking year-over-year as well for Gold and several of its key equity brethren, as noted at the outset the yellow metal itself is now -2% from where 'twas at this time last March, the stocks stacking up as follows: Goldcorp Inc (NYSE:GG) +1%, Franco-Nevada Corporation (TO:FNV) +8%, GDX (NYSE:GDX) (the prominent exchange-traded fund of the Gold miners) +12%, NEM (Newmont Mining (NYSE:NEM)) +27%, and Global X Silver Miners (NYSE:SIL) (the popular exchange-traded fund of the Silver miners) +45%. Sorta gives ya that "We just hit an air pocket" feeling, eh?
"Tell me about it, mmb..."
Well, Squire, at least you're a player, (to the extent we're willing to keep your trading account replenished; 'tis not exactly a taxable deduction out there). Perhaps toward improving your timing you ought put more serious focus upon the precious metals' 10-day Market Profiles as below displayed for Gold on the left and Silver on the right, (and as further updated daily at the website):

Next from near-term to the big picture of Gold's Structure by its monthly bars and defined layers. Therein note that the green bars are "up months" and the red bars "down months". This past January and February were both "up months", the rightmost red nub now being just these first three trading days so far in March. Here's the rub of that red nub: not since summer of 2012 has Gold recorded three consecutive "up months". If it can so do this time 'round, indeed such as to finish March clear above the 1240-1280 resistance zone, 'twould open the door for another run to Base Camp 1377. So can Gold make it three-for-three? 'Tis why we keep records, such that they can be broken:

Speaking of broken, we wonder: what is one smokin'? Bob Shiller's Cyclically Adjusted Price/Earnings Ratio for the S&P 500 is presently 29.36x; (our "live" reading using cap-weighted trailing 12-months earnings is 34.35x). Professor Shiller rightly suggests the high valuation is good reason for pruning one's equities holdings. But: one Warren Buffett said this past week, given the still low interest rate environment, that stocks are "on the cheap side". Can we please do a collective "Oh c'mon, man!" ?
Here are a few other parting quick hits:
■ From the "You Don't Say! Dept.", we nevertheless take to heart Josh Steiner's recent piece on China's economy being but one-quarter the combined economic size of the US and Europe ... yet the dragon's having taken on $24 trillion in debt since 2007 equates to that of the US/Europe debt increase from 2000 to 2007 ... and then came our Black Swan. Got some Gold?
■ From "The Lost World Dept.", in shaking Venezuela's piggy-bank, its sounds like the $30 billion it had in foreign reserves back in 2011, which just two years ago was shaken down to $20 billion, is now but $10 billion rattlin' 'round inside. Outstanding debt payments due in 2017? $7 billion. From Caracas to carcass. Got some Gold?
■ From the "Uh-Oh... Dept.", Bitcoin settled out the week at $1,260. Gold settled out the week at $1,235. Nuff said. Got some Gold?