We'll save the mathematical rationale of gold reaching 1400 in 2015 until this article's dénouement, as there first are more timely items to consider. Quel drame! Just stay with us.
I am blessed to have a bevy of just slightly more seasoned gold-aficionado confidants who, on occasion in their sincere "older brother" manner, remind me that the more one ages, the faster time passes. To be sure, the modernized world has immersed us into so extreme a geometrically growing rate of technological bilge, (one by-product being cultural decay), that nary do we have a non-electronic moment to ourselves anymore, such lack of self-reflection only furthering the apparent unrelenting acceleration of time. (I recall mentioning to a friend the importance of living one day at a time, yet upon one's crossing the threshold of age 60, such focus shifts to one hour at a time). But be it by aging or high tech engaging, 'tis what 'tis: and with the scent of last Christmas' tree seemingly still lingering in the parlour, the first five trading months of 2015 are amazingly already in the books. Thus as we cross into June, here are the BEGOS Market standings through May:
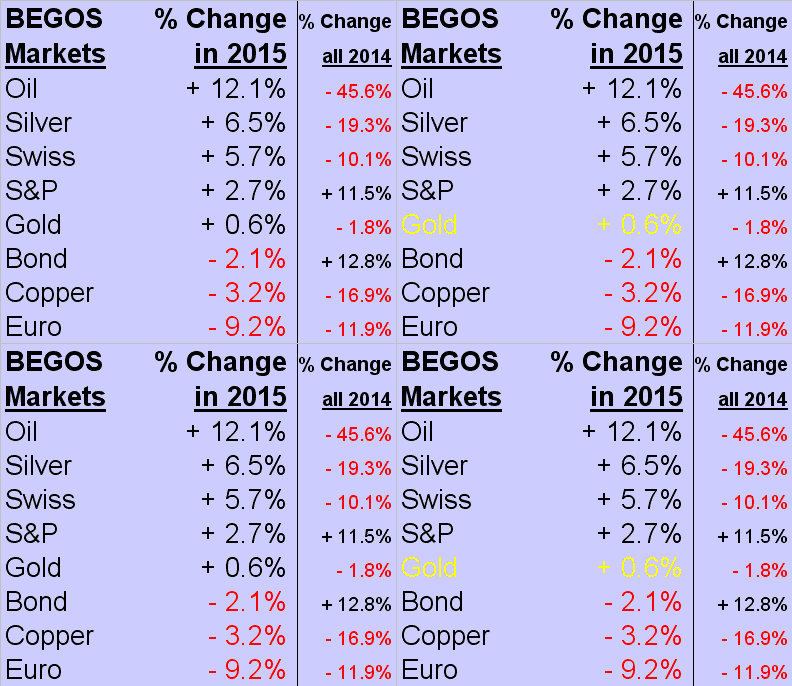
Big Oil's big lead (+12.1%) is twice that of second place Sister Silver (+6.5%)... yet surely she must be too high given that King Gold is but a mere +0.6%... which in turn also seems too high given that the euro is -9.2%, (the dollar index being +7.0%)... but then again gold ought not be down given the Swiss franc's being +5.7%, (such being the blame for Switzerland's economy have shrunk in Q1 by the most in six years). The point is: traditional correlations within the BEGOS Markets have given way to a rather "subdued-chaotic" caution. You and I see it; those complacently splashing about in the motherly womb of the stock market's serenity don't see it, nor do they care.
Meanwhile, what are they seeing over at the Federal Reserve Bank? Our own San Francisco Fed Head John Williams said this past Tuesday that a U.S. interest rate increase is likely before year's end, given expectations for economic growth above trend. Then chiming in on Thursday, the St. Louis Fed's James Bullard queried as to why the bank's policy isn't getting back to normal if the economy is so doing, furthering the need to "hedge our bets against any kind of asset price bubble forming." As if they've not already formed? Perhaps James ought fly out to the Left Coast and go house hunting with Fed colleague John here in San Francisco. To quote Trulia: "The median sales price for homes in San Francisco CA for Feb 15 to May 15 was $1,107,500." Talk about a bubble! And now we learned yesterday (Friday) that Q1 Gross Domestic Product growth was just reversed to -0.7%?
"And the Fed Head herself has mentioned the stock market bubble, mmb..."
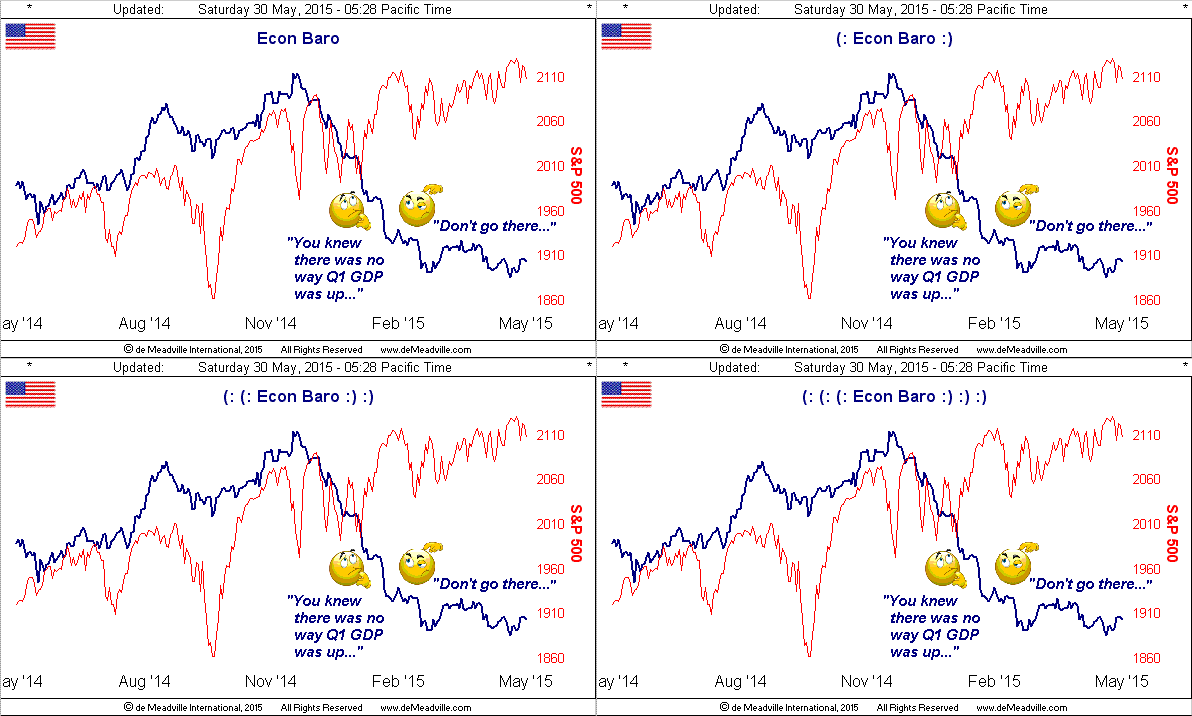
Oh heaven forbid they spoil that party, Squire. Besides as shown above, the S&P 500 is only +2.7% so far this year, (albeit 'tis tripled over the last six). Yet today's market mood is reminiscent of that back in 2000 when a FinMedia piece noted there were people who didn't realize that prices could actually go down as well as up. The Chinese, of course, know better: this past Thursday alone, the Shanghai market fell better than 6%. Has that ever happened StateSide since the turn of the millennium, given the institution of price limits, (and as some would add, the institution of the Plunge Protection Team, aka "PPT")? Not really. Oh, there were seven such days during the Black Swan Event of 2008, but that shan't recur. No. Even if those series of plunges did put price-earnings ratios back into proper range. In fact, there's been but one other -6% S&P day since 2000: 'twas on 08 August 2011, (within one month of gold's then reaching its All-Time High on 06 September 2011 of 1923), but it doesn't really count as stocks then fully recouped that loss within a mere week. And thus at then end of the day, life is financially good in here "Murka"; by short memory, 'tis always so been. And yet here's the Economic Barometer:
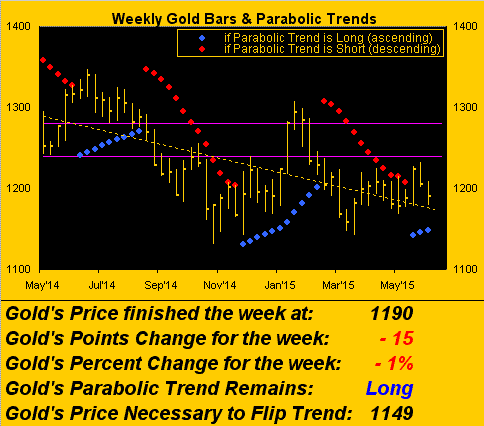
Specific to gold's year so far, its "Flight at 1200" is essentially intact, as is our "Sense that the Selling has Stopped," (putting at risk our little "friend's" job as we'll later see in this missive's final graphic and plausible posit of 1400 this year). Gold settled out the week yesterday at 1190 in marking the 102nd trading day of the year, better than one-half of which (55) have been daily settles within the 30-point range of 1180-to-1210. Here are gold's year-over-year weekly bars, their linear regression trend (dashed line) in decline, but the current parabolic trend (rising blue dots) in LongSide ascent despite the rightmost two weeks of price pullback:
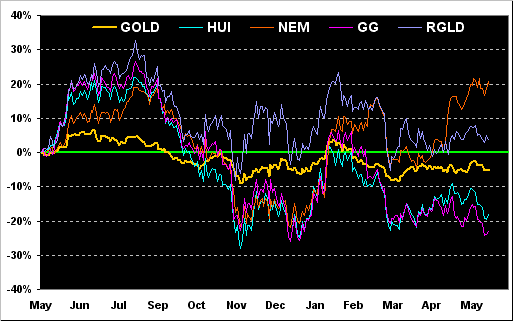
Again, it being month's end, 'tis time we also go year-over-year with gold and several of its more popular brethren, (recall we've revised the grouping to make it more relevant to the gold equities crowd out there). And as you can see below, gold itself is bisecting the bunch, with Newmont Mining (NYSE:NEM) and Royal Gold (NASDAQ:RGLD) biased to the upside, whilst the Gold Bugs Index ("HUI") and Goldcorp Inc (NYSE:GG) not as midas to the downside:
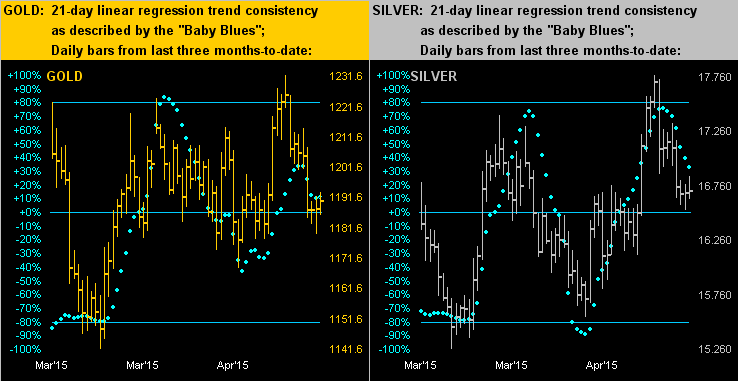
Now, let's zoom in on the last three months with the daily bars for both gold (on the left) and silver (on the right). We'd pointed out last week that silver's "Baby Blues" -- the dots that define each bar's 21-day linear regression consistency stance -- had already begun rolling over: so have they now as well for gold, although yesterday's price resiliency, (thank you poor Q1 GDP), may have just stemmed such weakness. Cease the pullback here and the 1200s are near:
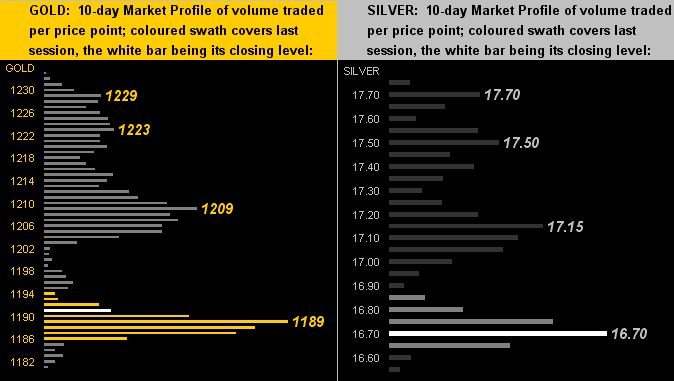
And in discerning the trading track for "near," here we've both metals' respective 10-day Market Profiles. For gold (left), clearly 'tis the 1189 area we wish to see hold, more contract volume having traded at that price that at any other level in the past two trading weeks. Similarly, the same can be said for silver (right), her price platform of popularity being the current 16.70 level. Hold both markets here and by their current "expected daily trading ranges" (14 points for gold and 0.40 for silver), the 1200s and 17s ought come back into play respectively:
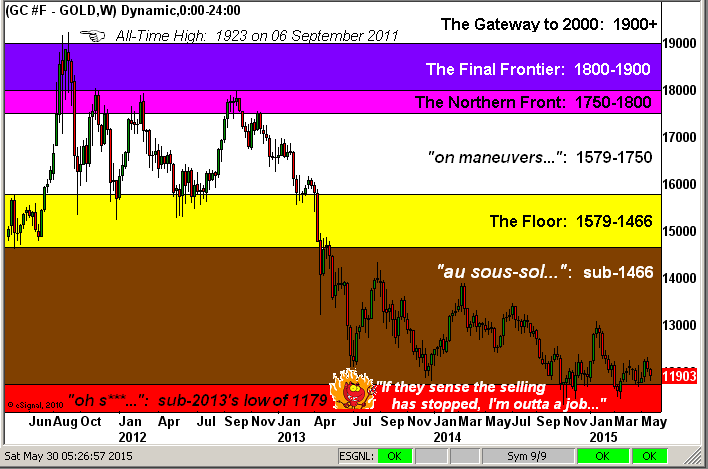
Finally to our closing graphic, the updated stance of gold's broad-based structure, now noting the concern of our aforementioned "friend." For the some two years now, recovery highs have been lowering, but more recent bottoms instead have been holding. Fairly classic consolidation continues. Moreover, with respect to gold 1400 this year, here's a number you've likely not heard: using the same formulae to produce our "expected daily trading range" for gold, when applying it to years, the "expected yearly trading range" for 2015 is 274 points. Thus, if the year's current low of 1142 holds through these seven remaining months, the "expected" high for the year within this calculative vacuum is 1142 + 274 = 1416; "You read it here foist!"
We'll wrap it here with these three quick reflections:
1) International Monetary Fund Managing Director Christine Lagarde was initially misquoted this past week in Frankfurter Allgemeine Zeitung to which she'd purported said that Greece's exiting the €uro is a "potential." The newspaper has since printed a correction. Nonetheless, one has to think that, based on payments to the IMF being due on a monthly schedule, going through such Grecian Grief month-after-month has to be unsustainable, in turn leading to Gold Relief.
2) Our beloved France has thus far been through a terrible year such as to hold us back from the occasional friendly pokes. Still, we took notice this past week of the French utility giant EDF (PARIS:EDF)'s looking to reduce its employees' annual vacation allotment of 10 weeks, inducing the workers to consider knocking time off back to seven weeks by a one time payout of some €14,000. To the extent that this shall violate the mandatory 35-hour work week limit, we're not sure, nor do we have the time to ferret it all out given that so many of us here StateSide surely put in 35 hours of work every 24 hours. Just pay us in gold.
3) And thank goodness there's the just-completed study by Cambridge University and Rand Europe to figure this out: lack of sleep lowers productivity. Who knew? (And whose money paid for the brilliant and in-depth efforts in coming to this conclusion?) The good news in the study's results was that neither drinking alcohol nor smoking seems to make any difference in productivity. We'll drink to that! "Barman? A pint of your best golden brew, please!"