
For now nine weeks running, Gold's weekly settle has neither exceeded 1191 on the downside, nor 1223 on the upside: that is a week-to-week closing range for two months spanning just 2.7% from low-to-high, or a mere 32 points. Think back to just 2016, a year which was peppered with trading days alone exceeding that range!
One might infer price is being "protected" from the downside, yet at the same time "suppressed" from the upside. Either way, it flies in the face of the excited daily writings across the Gold-authoring spectrum with its perennial expectations of big Gold up moves to occur at any moment, the failure of which made manifest making one downright "depressed"!
You'll recall a valued friend of ours here in Monaco having suggested that "Well, it's dead money, isn't it?" Upon that thought on occasion crossing our mind, the instinctive response remains "no, No, NO!" This present blip of quietude across Gold's otherwise 5,000-year span as de facto money quickly assuages such suggestion. That noted, we at times wonder -- given the go-go "nuthin' but stocks" nature of today's generationally-turned-over drooling directors of money management -- that they've merely passed over Gold as a critical wealth-preserving asset, and/or are sufficiently naive to understand the Gold Story whatsoever. Indeed, 'twas reported that in the past week investors poured resources into equity funds at the swiftest rate since March.
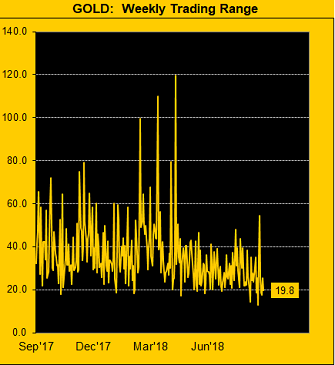
As for the ever-anticipated "big move", be it Gold on the brink, or simple out of monetary sync, its weekly trading range has become sufficiently narrow as below portrayed from one year ago-to-date, the week just past spanning less than 20 points per the box (19.8), a dimension from which price has then tended to become more volatile, (direction notwithstanding):
But direction being everything, one might intuitively state 'twill be "up" given Gold's having settled out the week yesterday (Friday) at 1203, the fresh parabolic Long trend still in its infancy at just two weeks in duration. 'Twould be nice to see protection lead to some upside beyond suppression! And as for the Gold/Silver ratio remaining at essentially historic highs, it really is hard to imagine the numerator actually dropping with the denominator rising; rather 'tis the latter alone which still has a monumental amount of catching up to do (understatement of a trading lifetime!) Here are Gold's weekly bars with their parabolic trends from a year go-to-date:

Speaking of direction as we turn to the StateSide Economic Barometer, since June the trends remain basically the same, i.e. up for the stock market as measured by the S&P 500's red line making further all-time highs, dragging with it kicking and screaming the "ridiculous extreme" (per yesterday's Prescient Commentary) "live" reading of the price/earnings ratio of 51.8x -- the high equities valuations having some analysts pointing to a "Hindenburg Omen" -- but down for the Econ Baro.
This past week's incoming data included August's lagging report of "Leading Indicators", not surprisingly missing (given the negative bent of the Baro) the consensus expectation and falling short of the prior month's reading. We oft are perplexed by the consensus crowd not simply looking at the Baro ahead of making their guesstimations. Further from the "Keep This Under Your Hat Dept.", according to Standard & Poors, the majority of the States do not have the reserves to "weather" the next recession. Again, mind that Baro:

As to our guesstimation for Gold to break out from its narrow trading range by moving higher, the "Baby Blues" are at a loss for so confirming as is clearly shown below left across the daily bars from three months ago-to-date, the 21-day regression trend being as flat as a crêpe. And as for the narrow points span across the 10-day Market Profile below right, the dominant trading supporter is 1201 and the dominant trading resistor is 1208. Ain't that great? Tight as a drum 'tis!

Sister Silver's similar graphic actually looks a bit more upside promising, which again given the Gold/Silver ratio of 84.1x ought well be the case. Her baby blue dots (left) of linear regression trend consistency are again making a valiant effort to get up off the -80% mat, whilst her price in the Profile (right) sits mere pips above trading support at 14.25:

Finally as anticipated, in strolling past the offices here of the Monoeci project, one has to say they appear fairly shuttered, although we did therein glimpse a lone, desk-bound soul. You'll recall that like the Venezuelan Bolívar's 99% decline year-to-date, the Monoeci has suffered the same percentage loss, albeit we've seen no publicity thereto. 'Course, discretion, proper decorum and privacy are the way of the world here such that we may, or may not, know to where it all shall go.
What we do know is that the Federal Open Market Committee is all geared up to goad up their Bank's Funds rate come this Wednesday, (26 September), featuring Chairman Powell in the post-pump press conference. As to how the yellow metal responds, be it protected yet suppressed such that you're feeling depressed, clearly 'tis best to hang onto your Gold!