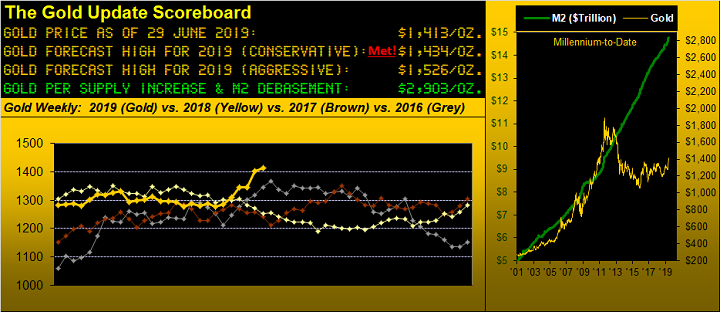
Two weeks ago Gold ~finally~ surpassed the long-sought level of Base Camp 1377: check off that milestone box!
Then during this past week, Gold met (per the above opening Scoreboard) our "conservative" forecast high for this year of 1434: check off ~that~ milestone box!
"You're making this sound like Gold can never go back down through those levels, mmb..."
Setbacks certainly do occur, Squire. To wit, Pluto was demoted from planetary status, Senator Clinton won but didn't, and Shrewsbury's Jesse Livermore went from $0 to $100,000,000 to $0. It happens.
Indeed following Gold's monumental setback from the years 2011 through 2015, price then spent 2016 through 2018 directionlessly thrashing about as would a wayward weasel upon a heat shimmerin' Georgia highway. But come this year amongst Fed musings of rate relenting, recognition of the Economic Barometer's sliding for a full year, (Chair Powell himself noting this past week to the Council on Foreign Relations that the economy is facing growing uncertainties), dashes of geopolitical discourse, the 3Ds of Debasement, Debt and Derivatives actually making mainstream media coverage, (plus we'd like to think our weekly reminding that Gold today "ought be" at nearly 3000 simply to get re-aligned with the StateSide money supply), and --- "Jump back, Loretta!" -- Gold in 2019 is getting a bone fide bid. 'Tis clearly the case since price vaulted up outta The Box (1280-1240) just five weeks for a gain since then (from 1280 through this past week's high at 1442) of 12.7% before settling yesterday (Friday) at 1413.
The point is, as we herein pointedly pointed out last week, Gold shan't rise in straight-line perpetuity. 'Twill go up and 'twill go down. But the key now is for Base Camp 1377 to prove its mettle in morphing from essentially three years of resistance back into support as was its stance during May-June 2013 following Gold's fall from grace, (before it all then really went off the cliff to as low as 1045 on 03 December 2015). But price now having retaken 1377 is a milestone, as is having reached 1434. Here are the weekly bars from a year ago-to-date:
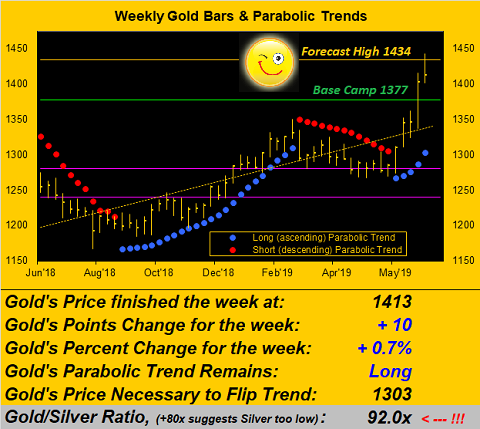
Note, too, that the week's settle of 1413 is a full 2.0% beneath the 1442 high. Again per last week's missive and the website's daily Prescient Commentary, we've been pointing to Gold's being some 100 points "high" vis-à-vis its smooth valuation line (per the Market Values page), so that 2.0% retrenchment is not untoward a bit. Rather, 'tis all now about Base Camp 1377 being supportive should it be tested.
"But what about looking up the road, mmb?"
Squire, let's briefly review as to why we selected 1434 as our "conservative" high for not just this year (achieved) but as well as for last year (not achieved). Nearly six years ago on 28 August 2013, Gold reached up to tag 1434, only to have beneath that level ever since, until just this past week. Every trading algorithm from Bangor, Maine to Honolulu and right 'round the rest of the world knows that. Further with respect 1434, here's what we wrote in closing out December 2017, for it has played out -- albeit a year and a half later -- to a tee:
"...at 1377 we look for the fun to begin. You know the old trading expression that "Triple tops are meant to be broken"? As price closes in on 1377, 'twouldn't surprise us a wit see a zillion buy stops hit the market just in or above there. That, in turn, ought open the top fuel dragstrip for the nitro-burning drive back above 1400, the finish line being a retest of 1434 for the year's high..." Bingo: it just happened, (plus a l'il overshoot to 1442), and smack in the face of the "barberous relic" never-Gold nattering nabobs of negativism.
Moreover, as you day counters well understand, 1,977 trading days ago marked Gold's highest ever closing price: 'twas exactly 1900 on 22 August 2011. And as we next update our chart of Gold's pricing by the "100s" -- as mathematically remains the case 'cause we ain't revisited above here -- there's been comparatively scant little trading from the 1400s up to the 1600s...
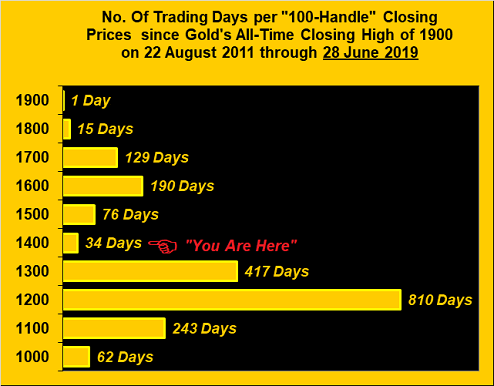
...and you know the other old saying: "All gaps get filled" (well, almost all do). Either way, from here in the 1400s up to the 1600s, as you can see there's quite a lot of pricing gap to "fill in", so to speak.
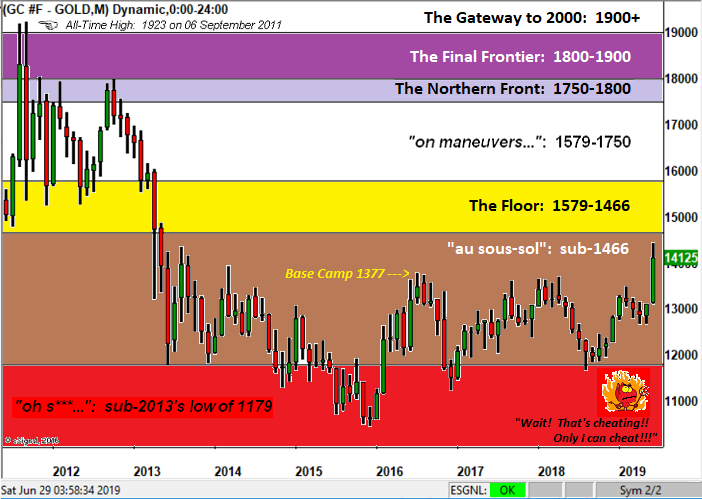
So per Squire's question in looking up the road, beyond 1434 as next shown here in the Gold Structure chart is 1466 from which Gold can emerge from the basement ("sous-sol") up onto The Floor, that zone also incorporating our "aggressive" forecast high for this year of 1526. But first things first: barring further fundamental push, we now look for price to consolidate 'round here, ideally staying north of Base Camp 1377, in turn allowing for some of the stretched technical measures to catch up. Here is the broad-based structure chart of Gold by the month:
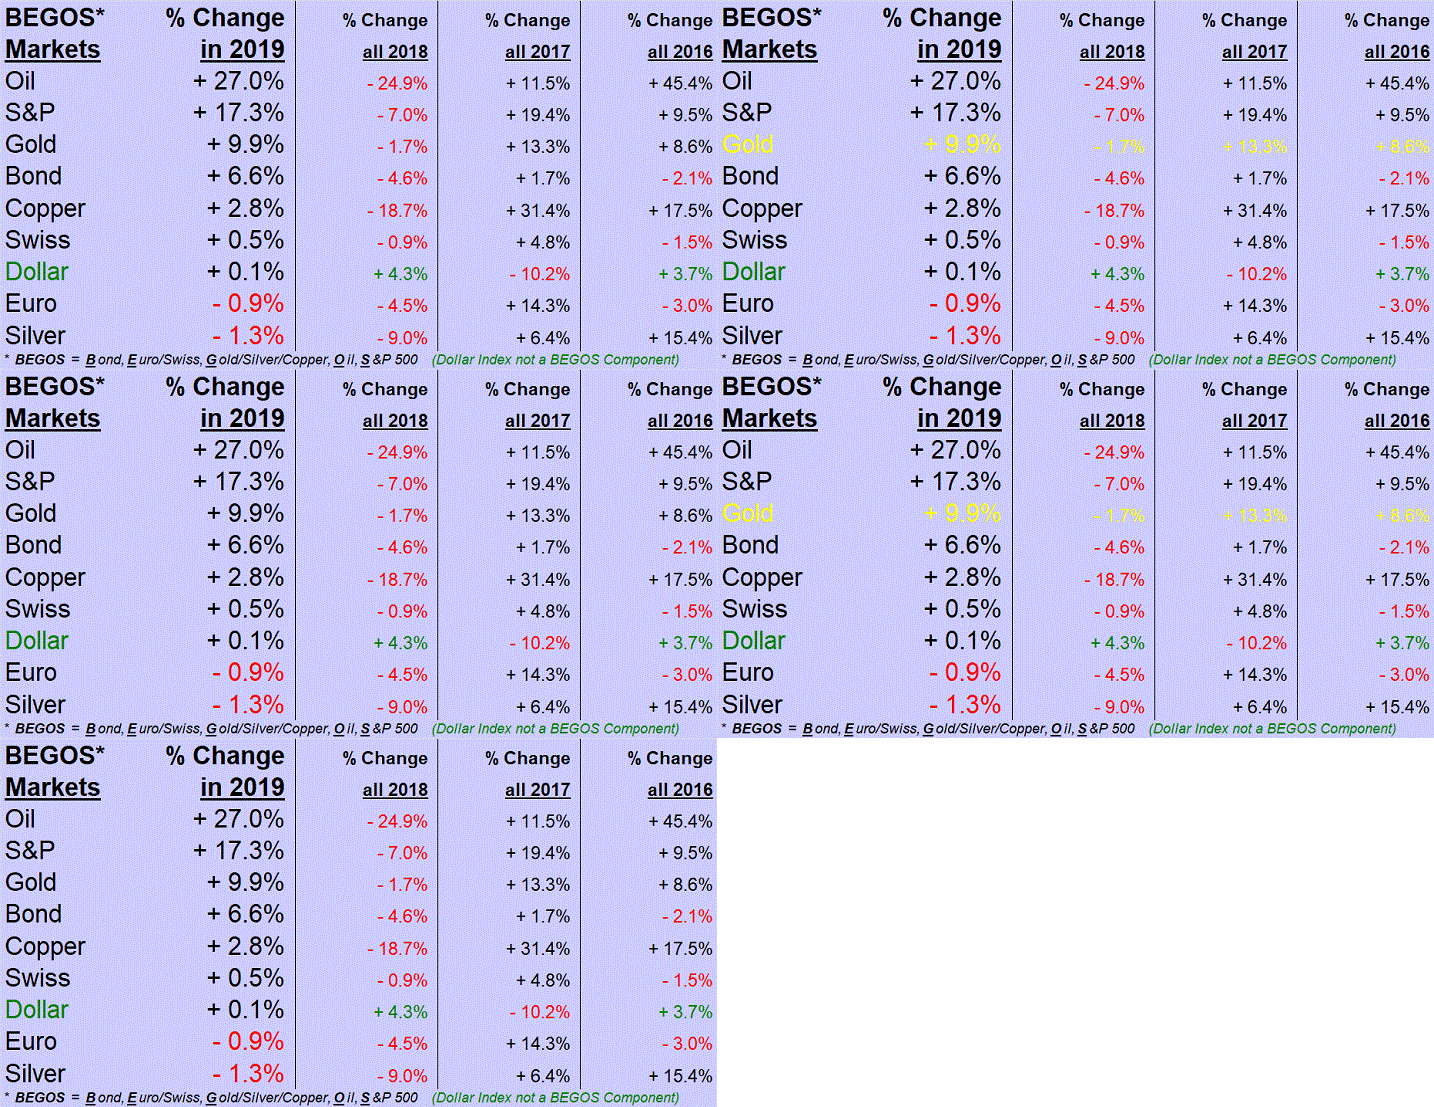
Next from the "It Goes Quickly Dept." we are reminded of Irma Bunt explaining to James Bond that "So, we are halfway..." in transiting through the snow from the horse-drawn buggy to the helicopter for the ascent up Switzerland's mighty Schilthorn, --[OHMSS, Eon Productions, '69] as indeed the trading year already is half gone. We thus to turn our BEGOS Market Standings year-to-date, wherein we find Gold having gained a provisional podium place in third, but with Silver still comprehensively disrespected at the short end of the stack, the Gold/Silver ratio now an inane 92.0x. Also note that the dollar is not down despite Gold's being +10%, the yellow metal again reminding us that it plays no currency favourites:
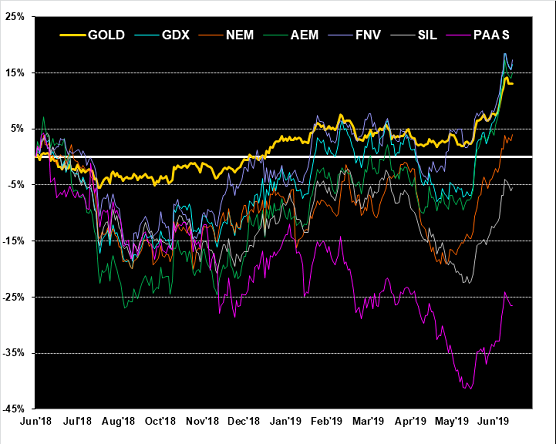
As well it being month's end, 'tis time for our year-over-year percentage tracks chart of Gold vs. key of the precious metal equities. And at the sound recommendation of a cherished charter reader of The Gold Update, we've added Agnico Eagle Mines (AEM) to the group. The company's "superb" management has expanded its one-time mining operation to now seven bountiful locations, in turn graduating this once mid-tier miner to one of senior status. And from a year ago-to-date, AEM has charted amongst the best of the bunch, which from top-to-bottom rank as follows: both Franco-Nevada (NYSE:FNV) and the VanEck Vectors Gold Miners exchange-traded fund (GDX (NYSE:GDX)) are +17%, AEM is +15%, Gold itself is +13%, and Newmont Mining (NYSE:NEM) in the wake of taking on Goldcorp is +4%. But as still Silver suffers, so do her equities: the Global X Silver Miners exchange-traded fund (NYSE:SIL) being -5%; and Pan American Silver (NASDAQ:PAAS) dreadfully -26% ... (can you say "value"?):
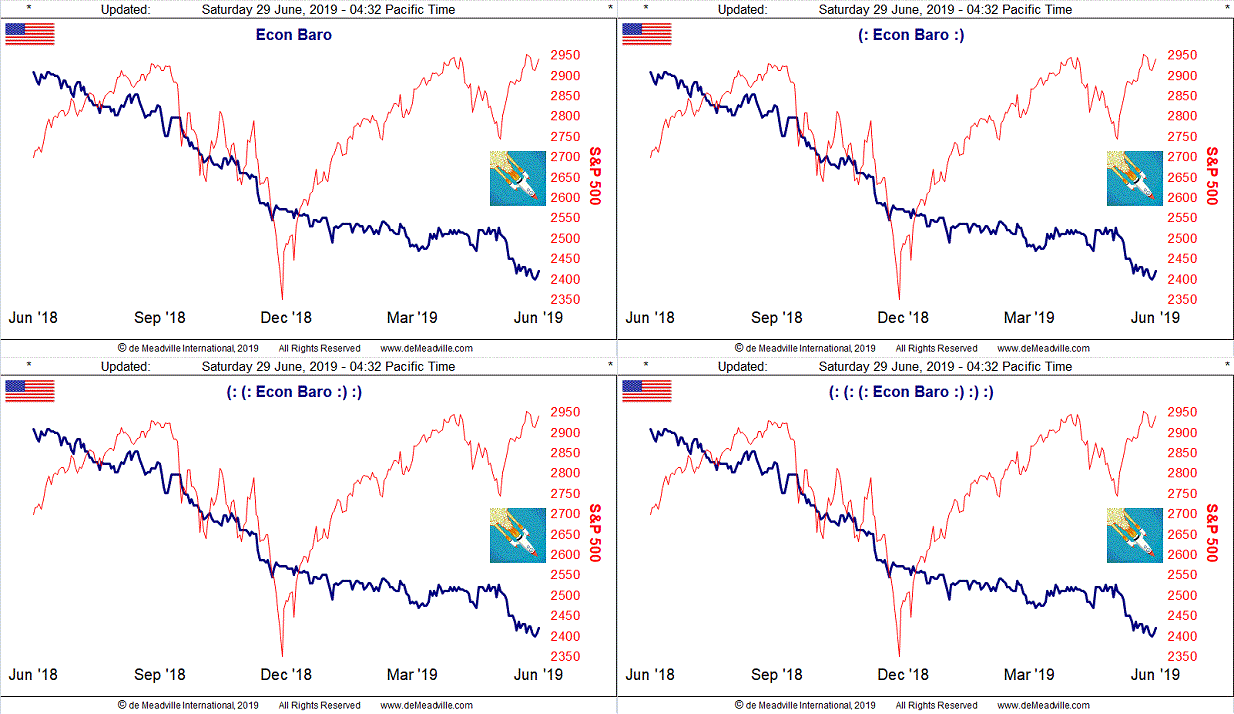
As for the aforementioned Economic Barometer, beyond it getting affirmation this past week of Q1 Gross Domestic Product having grown at a +3.1% annual pace and May's Personal Income/Spending remaining firm, there were some potholes: that month's New Home Sales slowed and Orders for Durable Goods again shrank, whilst June's Consumer Confidence materially waned and the Chicago Purchasing Managers Index slipped below the critical 50 level, indicative of contracting activity. Here's the Econ Baro, the red line of the S&P 500 well overdue to rocket down toward the level of the Baro's blue line:
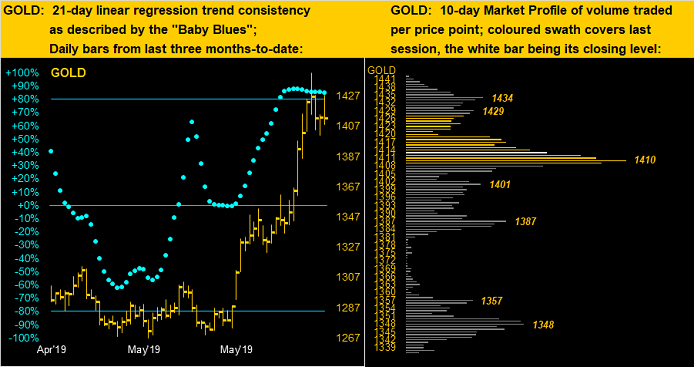
Toward this week's wrap, we drill down into the precious metals' pricing at present. First, for Gold in this two-panel graphic are the daily bars with their "Baby Blues" on the left and the 10-day Market Profile on the right. And mind those blue dots, for upon their going under the +80% line, the rule of thumb is to then expect lower prices, which barring a surge from here would instead test the supportive mettle of Base Camp 1377, above which the last line in the sand per the Profile is 1387:
As for poor ole Sister Silver, her "Baby Blues" (below left) have already crossed below the +80% axis: we're thus expective of a move that could test the high 14s, her Profile's (below right) lower supporter showing at 15.05:
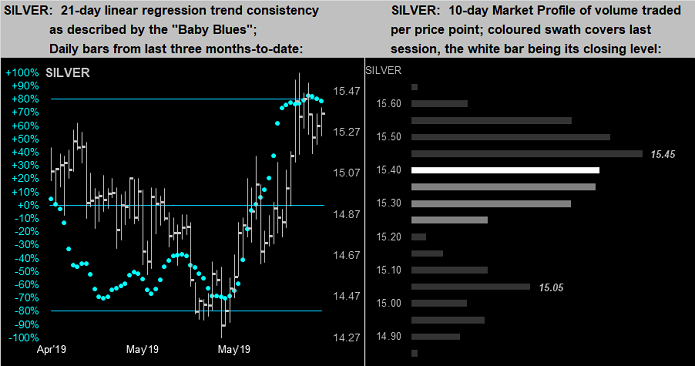
So: another milestone for Gold in the new week? No. Rather we see churning throughout, punctuated perhaps by some reduction in volume given the StateSide holiday here come Thursday, which essentially works into a four-day weekend for many-a-trader out there. But make no mistake: Gold these last two weeks having achieved as milestones both 1377 and 1434 marks the most material technical rise for the yellow metal following three years of endlessly flailing about. Enjoy the moment, weather the near-term pullbacks, and we'll see what lies further up Gold's road before this year is out!