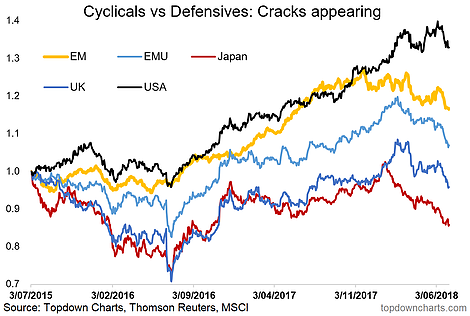
Summary- Investors are overlooking the weakness we're seeing across global cyclicals vs defensives as the major regions roll over.
- As cyclical stocks are typically at the crest of changes in the economic cycle, this chart is worth keeping front of mind.
- We believe investors need to be paying closer attention to the global picture right now.
This idea was discussed in more depth with members of my private investing community, Weekly Best Idea.
This week it's global cyclicals vs defensives. Last week we talked about the yield curve, which is something a lot of people are talking about, but when it comes to global cyclicals vs defensives this is something that we feel a lot of people are missing, as cracks are starting to appear.
The chart comes from a report on the tactical view for Global Equities, which also covered global market breadth, valuations, and the earnings outlook.
Basically the chart shows the previously strong cyclicals sector progressively rolling over across the major regions of the globe. Given this part of the market is typically at the crest of changes in the economic cycle it's worth keeping front of mind, particularly as growth risks emerge.

First, a quick note on the chart. The chart shows the relative price performance of cyclicals vs defensives (as defined by the MSCI) [note, EM = MSCI Emerging Markets, EMU = the Eurozone]. The relative performance lines are rebased to 1 as at the middle of 2015. To be clear, if cyclicals are outperforming defensives the lines will be rising, if defensive stocks are outperforming cyclicals then the lines will be falling e.g. now.
The economic logic behind why the chart matters from a macro/risk management perspective is that cyclicals typically outperform defensives during an upturn, and vis versa (e.g. think of consumer discretionary vs staples) as cyclicals benefit disproportionately from greater confidence and expansion. Indeed, we saw a blistering pace of outperformance by cyclicals last year as the global economic expansion picked up pace.
But what would be causing such weakness? Outside of the US we've seen economic sentiment indicators soften across the major economies, risk pricing indicators flare-up in Europe and emerging markets, and a significant rally in the U.S. dollar. Part of this is down to the turning of the tides in global monetary policy settings, but no doubt the trade war talk is also weighing and sometimes a simple lift in uncertainty can trigger off a feedback loop of slower activity and more uncertainty.
So, while we don't want to be jumping at shadows, it's hard to dismiss the cautionary tone sounded in this chart and we believe investors need to be paying closer attention to the global picture right now.
