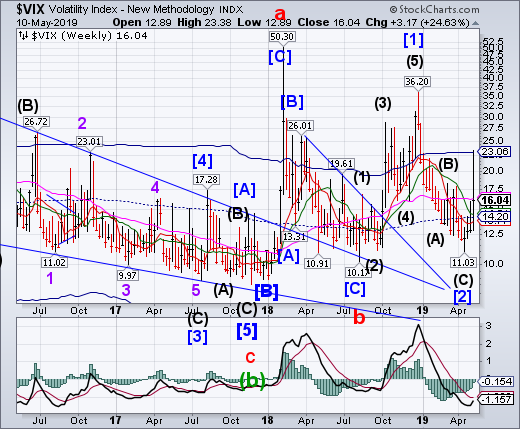
VIX rallied to challenge the weekly Cycle top before closing beneath Long-term support/resistance at 16.36. The Cycles Model suggests Cyclical strength may dominate through mid-May, possibly longer.
(MarketWatch) A spike in Wall Street’s most popular volatility gauge is inspiring some unpleasant déjà vu for stock-market traders, though there is no guarantee the move presages a sharper equity selloff.
The Cboe Volatility Index VIX, -16.02% known by its ticker, VIX, jumped 6.45 points over the first two days of this week — the largest two-day rise since the period ending on Dec. 24, according to Dow Jones Data Group, when it climbed by more than seven points as a stock-market selloff accelerated, taking the S&P 500 SPX, +0.37% to the brink of bear-market territory and marking the lowest point of the fourth-quarter downturn.
SPX challenges Short-term support
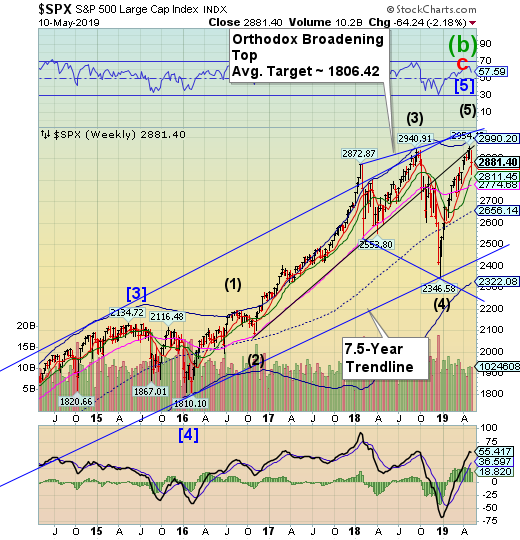
SPX broke down through Short-term support at 2867.28 but managed to close above it. Friday’s bounce managed to retrace 50% of the decline since the beginning of the week. “Point 5” in the Orthodox Broadening Top formation may have been put in. A sell signal may be generated beneath Short-term support. “Point 6” lies beneath the December 26 low.
(BusinessInsider) All it took was one word to rescue the stock market from disaster: constructive.
And equities certainly needed saving after President Donald Trump said, ahead of the opening bell, that there was no need to rush trade talks with China. He added that soon another $325 billion worth of Chinese goods would be hit with fresh tariffs.
NDX makes a reversal
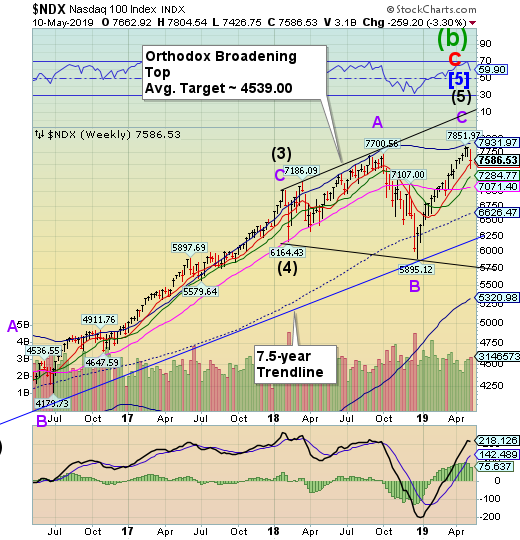
NDX made a lower high in the prior week before it began its decline on Monday. The Orthodox Broadening Top appears to be the primary formation. Cyclical strength indeed ran out as expected and may not reappear until the end of May. A sell signal awaits beneath Short-term support at 7518.31.
(Fortune) We were just wrapping a dinner panel in San Francisco to promote the upcoming Fortune Global Sustainability Forum in China’s Yunnan province this fall when news emerged that another round of U.S. tariffs against its trade adversary would shortly take effect.
That trade talks were faltering, the ones for which the Artist of the Deal previously set a March 31st deadline for completion, was of intense interest to the panelists, Deutsche Bank’s Priscilla Lu and Andrew Chung, a venture capitalist with 1955 Capital in Silicon Valley. Both invest in China. Both see a challenging road ahead given the inevitability of China’s growth and continued tensions between the two economic superpowers.
High Yield Bond Index tests long-term support
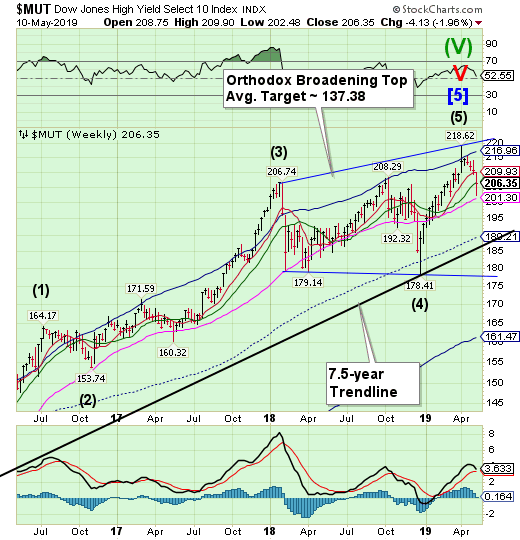
The High Yield Bond Index continued its decline, testing-term support at 201.30. A sell signal has been confirmed. Point 6 may be the Cycle Bottom at 161.47. The Cycles Model warns the decline may have legs.
(Bloomberg) As demand for one of Wall Street’s hottest fixed-income products cools, money managers are divided over whether it’s time to bow out or go bargain hunting.
Collateralized loan obligations are one of the few assets classes that have largely resisted spread tightening in 2019. After reaching about 141 basis points over the London interbank offered rate at the end of last year, the average pickup for new issue AAA rated tranches has remained in a tight range ever since. In contrast, yields on high-grade corporate bonds have tightened 39 basis points, while those on top-rated commercial mortgage securities have narrowed 28 basis points, according to data compiled by Bloomberg and JPMorgan Chase & Co (NYSE:JPM).
Treasuries resume the rally
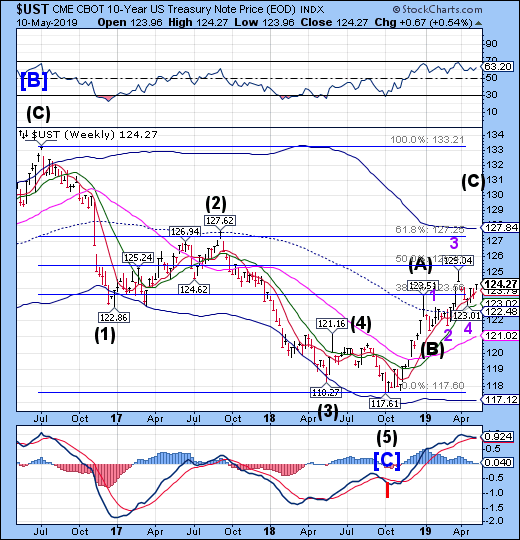
The 10-year Treasury Note Index rallied above Short-term support at 123.79. It remains on a buy signal with a potential target at the Cycle Top resistance at 127.83. The Cycles Model suggests the rally may continue through mid-June.
(CNBC) U.S. government debt yields ticked lower on Friday after American tariffs on $200 billion worth of Chinese imports rose to 25%, a development some investors viewed as a sign that trade relations between Washington and Beijing won’t be remedied soon.
At around 10:55 a.m. ET, the yield on the benchmark 10-year Treasury note, which moves inversely to price, was lower at around 2.433%, while the yield on the 2-year Treasury note was also lower at around 2.235%. The yield on the 3-month bill hovered at 2.431%.
The euro trend is still driven by weekly Short-term resistance
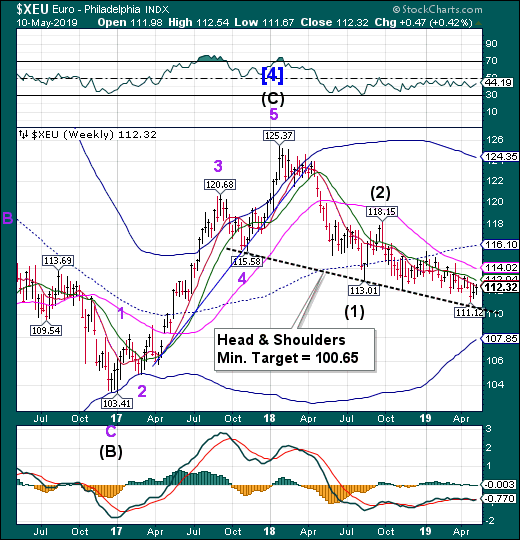
The euro attempted another bounce but was stopped by weekly Short-term resistance at 112.43. It may be capable of a breakout to Long-term resistance in the next two weeks.
(Nasdaq) The euro firmed on Friday and is poised for a second consecutive week of gains on growing fears that any escalation in the trade conflict between the United States and China would force U.S. policymakers to cut interest rates.
U.S. President Donald Trump’s tariff increase to 25% from10% on $200 billion of Chinese goods kicked in on Friday, and Beijing said it would strike back. The two sides are pursuing last-ditch talks to try to salvage a trade deal. urn:newsml:reuters.com:*:nL3N22M1D4
While U.S. and Chinese officials return to the negotiating table later on Friday, investors have quietly ratcheted up bets of a U.S. interest rate cut, with markets now roughly expecting one rate hike by the end of 2019.
Euro Stoxx makes a new retracement high
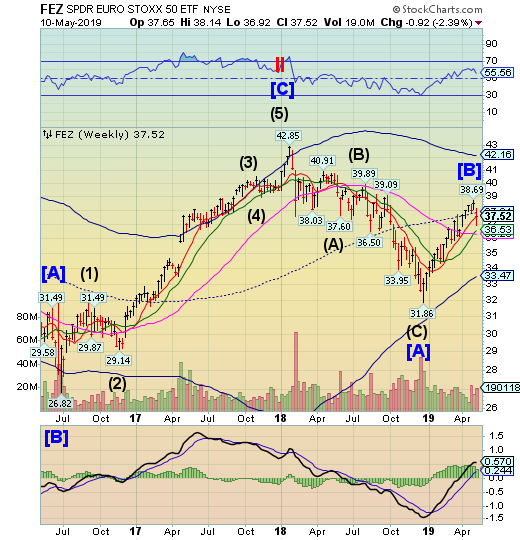
Note: StockCharts.com is not displaying the Euro Stoxx 50 Index at this time.
The EuroStoxx 50 SPDR launched higher from mid-Cycle support at 37.78 in a final burst of strength that may expire this weekend. A sell signal awaits beneath Short-term support at 37.30. The Cycles Model suggests 3 or more weeks of decline may lie ahead.
(CNBC) European stocks closed higher on average Friday despite the U.S. hiking duties on $200 billion worth of Chinese products.
The pan-European STOXX 600 climbed provisionally 0.4% higher, with the export-heavy German DAX index rising by 0.85%. All but three sectors closed in positive territory, with only the autos sector, with its heavy exposure to China, edging below the flatline.
Washington increased tariffs on Chinese goods from 10% to 25% overnight. China immediately said it would retaliate, though did not specify how. But European investors have not been spooked by this latest chapter in ongoing trade tensions between the two economic superpowers.
The yen advances briskly
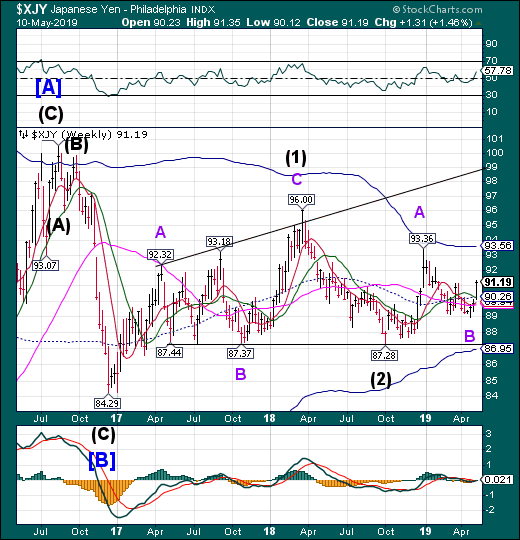
The yen advanced above all critical resistance area while it reinstated the buy signal. The Cycles Model suggests a rally in strength through the end of May, possibly longer.
(Reuters) – The U.S. dollar ticked up against the safe-haven Japanese yen on Friday as hopes rose for a U.S.-China compromise on trade.
Traders’ optimism could also be seen in the Australian dollar, a proxy for Chinese economic prospects, which was 0.14% higher, at $0.700. But there was a cautious tone to the investor optimism and moves across currencies were muted.
Against a basket of six rival currencies, the dollar was 0.04% weaker at 97.331. Against the yen the dollar was last up 0.13% at 109.89.
“Risk has actually traded remarkably resiliently,” said Alan Ruskin, global head of currency strategy at Deutsche Bank (DE:DBKGn). Earlier this week, there were “some fairly sizeable risk-off moves, particularly in dollar/yen, (but) there has been no real follow-through today.”
Nikkei makes an “Island Reversal”
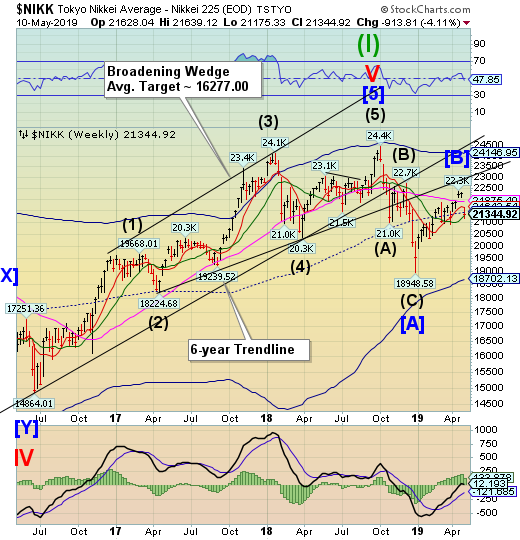
The NIKK gapped down on Monday beneath Long-term support at 21875.40. The concern that the island may have been formed by an exhaustion gap proved correct. The Nikkei challenged Intermediate-term support at 21273.03 but closed above it. It may be considered to be on a sell signal.
(Reuters) – Japan’s Nikkei rebounded on Friday morning, snapping a four-day losing streak as investors waited for the outcome of U.S.-China trade talks, while Panasonic tumbled 4 percent on a weaker-than-expected profit forecast.
The Nikkei share average rose 0.6 percent to 21,522.89 in midmorning trade after four losing sessions. The benchmark index has shed 4.3 percent since reaching a 2019 high on April 24.
U.S. dollar has a quiet week
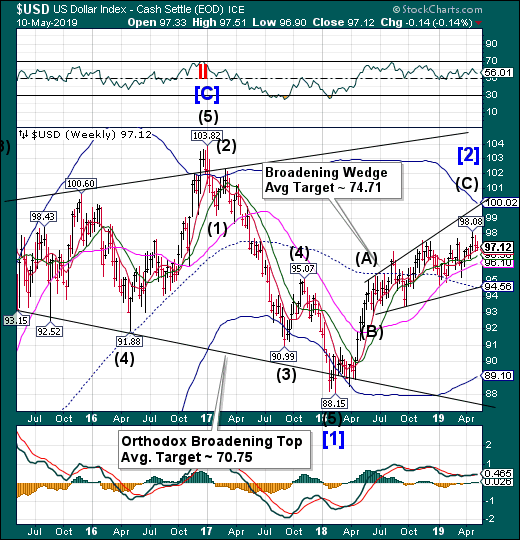
USD had a surprisingly quiet week, considering all that happened in the rest of the markets. The Cycles Model suggests that any residual strength may evaporate over the weekend or early next week. It appears that Dollar weakness may prevail over the next two months or longer.
(YahooFinance) Speculators cut their net long bets on the U.S. dollar in the latest week, according to calculations by Reuters and Commodity Futures Trading Commission data released on Friday.
The value of the net long dollar position was $38.08 billion in the week ended May 7, down from $38.88 billion the prior week.
To be long a currency means traders believe it will rise in value, while being short points to a bearish bias. The speculative market has been long on the dollar since mid-June last year.
Gold rallies from mid-Cycle support
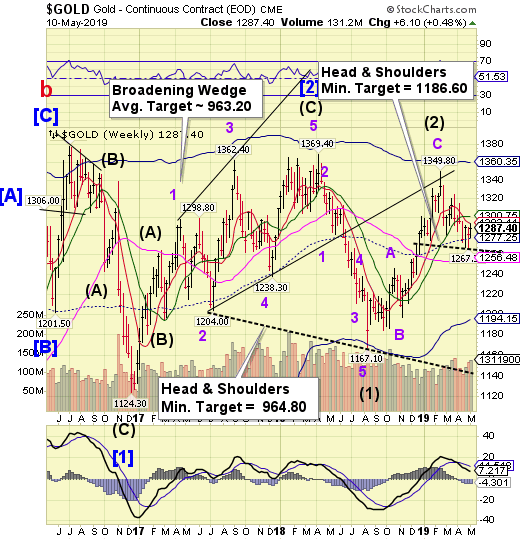
GOLD bounced from mid-Cycle support at 1277.25, but stopped at Short-term resistance at 1293.11. Another week of strength came and went without retesting round number resistance at 1300.00. There may yet be another attempt this week. The neckline has been repositioned for a new sell signal beneath it.
(Reuters) – Gold prices rose on Friday and were set to post a weekly rise as the United States raised tariffs on Chinese goods, exacerbating fears of a global economic slowdown, while palladium surged more than 5% on technical buying and short covering.
The United States intensified a tariff war with China on Friday by hiking levies on $200 billion worth of Chinese goods. U.S. President Donald Trump said on Friday he was in no hurry to sign a trade deal with China.
The escalation in the U.S.-China trade dispute has weighed on stock markets worldwide and boosted demand for assets viewed as safer.
“Gold is up today and will be up in the short term until there is a concrete resolution to the continuing trade tensions between the United States and China,” said Rob Lutts, chief investment officer at Cabot Wealth Management.
Crude challenges combination support
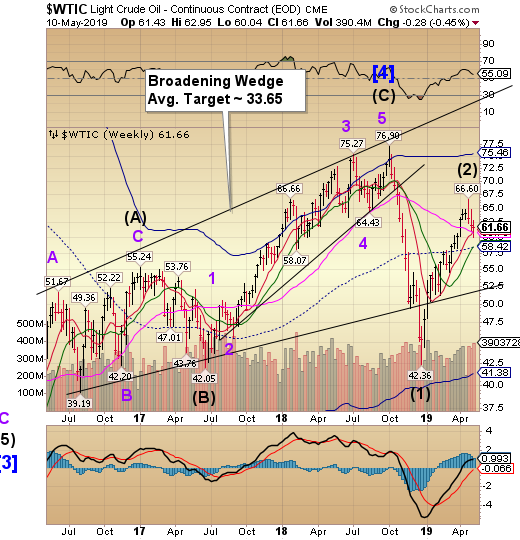
Crude declined on Monday to a new low, challenging Long-term support at 60.75 and Short-term support at 61.17, but closed above both. Confirmation of a sell signal lies beneath Long-term support. The ensuing decline may last another month once supports are broken.
(OilPrice) Crude oil prices inched higher after the Energy Information Administration today reported a draw in U.S. crude oil inventories of 4 million barrels for the week to May 3.
This compared to a hefty 9.9-million-barrel inventory build last week, which pressured prices substantially, adding to already significant pressure from rising production in the U.S. and elsewhere that countered concern about lost Iranian supply.
In gasoline inventories, the EIA reported an estimated fall of 600,000 barrels for last week, after a 900,000-barrel increase two weeks ago. Production in the week to May 3 averaged 10.1 million bpd, versus 9.9 million bpd in the previous week.
Shanghai Index had an awful week, despite intervention
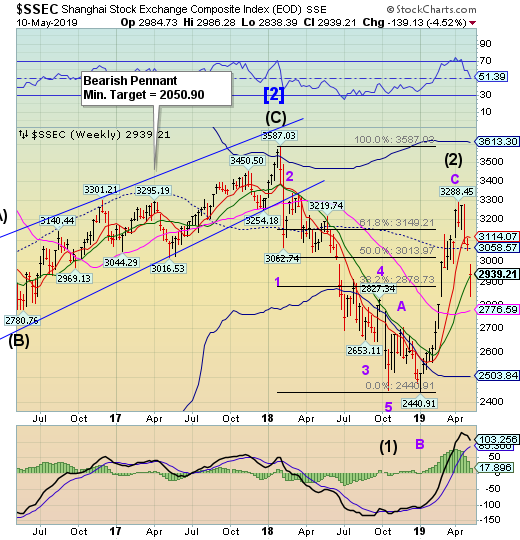
The Shanghai Index plunged beneath Intermediate-term support at 2932.17, but closed above it this week after a 101-point bounce on Friday. While there may be a consolidation during options week, the longer term direction is down. The Cycles Model suggests the decline may last through the end of June.
(Bloomberg) Chinese state-backed funds were active in buying domestic equities on Friday after they had slumped in the wake of the Trump administration imposing the biggest hit yet to China’s exports to the U.S.
State funds jumped in after the lunch break, when the Shanghai Composite Index dropped 0.4% after being up as much as 2.6% in the morning session, according to two people familiar with the matter. That helps explain the sharp V in intraday trading, one of them said, asking not to be named discussing private information.
By the close, the Shanghai Composite was back up 3.1%. By contrast, Japanese shares — which had also risen in the Asian morning session — closed down in the wake of the escalation in tensions between the world’s two largest economies.
The Banking Index squeezed into a corner
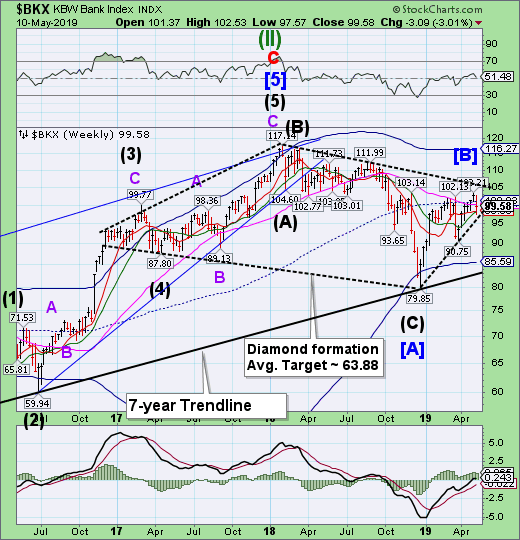
BKX fell 4% this week before a Friday rally granted a reprieve from the decline. The Cycles Model suggests a Master Cycle low may still come next week. Caution is the byword. A breakdown in the Diamond formation may lead to a substantial decline.
(Zacks) Amid widespread global investigation by U.S., British, Swiss and European Union (EU) regulators into the alleged foreign exchange market manipulation, seven major global banks are likely to be imposed with fines in the coming weeks by EU antitrust regulators, Reuters reported. Banks have been accused for rigging prices in the $5.1 trillion-a-day foreign-exchange market.
Though the EU has been sluggish in its investigation, global major banks have already faced up to $10 billion in penalties by the U.S., U.K. and Swiss regulators. Notably, after two years of penalizing the financial firms for collusion of Libor and Euribor rates, the EU is nearing conclusion of its six-year long investigation for rigging prices.
(ZeroHedge) Ask any banker (or analyst) what the difference is between a junk bond and a loan, and you’ll most likely get a blank start in response: starting with the size of the loan market, which is now virtually identical to that of the high yield bond market, continuing through the standardization of loan terms, the growth of secondary trading, and all the way through to “protections” granted to loan investors, which in an age of exclusively covenant-lite issuance, no longer exist, and one can argue that at least superficially, a loan is effectively the same as a junk bond. And yet, there is one critical difference between the two: junk bonds are securities, while loans aren’t.
(That difference, however, may not be true for much longer. As Bloomberg reports, a group suing JPMorgan Chase and other banks over a loan that went sour four years ago is alleging the underwriters engaged in securities fraud. If successful, the article contends correctly, the lawsuit will “radically transform the $1.2 trillion leveraged lending market” because should the plaintiff ultimately prevail in arguing that loans are de facto securities, it would dramatically alter how American companies raise debt, according to two industry groups that filed a brief supporting the defendants’ argument last week.
