Forex News and Events
German PPI increases but…Deflation is the new norm
This morning, the German PPI index came in slightly above expectations at 0.2% m/m. Yet, on an annualized basis, the PPI is still negative with a -2.0% performance over the last year. The German indicator continues to increase and the short-term trend is rather positive. Additional pressure on consumer prices are now expected.
The situation in Germany is being closely scrutinized by financial markets as a new impetus towards deflation would be a clear signal that the ECB is going to further ease in September. For the time being in European strong deflation pressures abound and markets are continuing to price massive intervention. Indeed, stocks and bonds markets are already way into a great bubble, with German 10-year government bonds for example currently yielding negative.
In our view, the rise of oil prices has certainly pushed PPI to edge higher. This increase however, remains somewhat limited. The PPI will only provide a clear indication of recovery when it is above a decent threshold on an annualized basis - above 2% would be ideal. In the meanwhile, there’s really no other question to ponder other than how this massive stock and bonds bubble will end.
Don’t believe the USD hype
The Fed’s communication strategy is suffering from a lack of credibility. This week, Fed speakers consistently provided a hawkish message yet, the USD and more importantly the US yield curve, failed to reprice a September rate hike. The rates markets estimate a low probability for a September hike at 20% and 45% for the December FOMC meeting. Clearly the markets don’t trust the Fed’s language (why would they considering its track record?). New York Fed President Dudley has indicated that the US economy remains strong, supported by a healthy labor market and rising wage prices and suggested that the markets were underpricing the probability of a Fed tightening. Meanwhile, Dallas Fed President Kaplan suggested that there was room for the Fed to raise rates. These comments seem to be preparing the groundwork for Chair Yellen’s speech at Jackson Hole to signal a rate hike. A sudden shift in expectations would clearly catch the market flat-footed, quickly lifting US front-end yields and providing a boost to USD. However, we suspect those analysts calling for a hike are missing the global context and overestimating historically marginal US economic strength. The US economic momentum only appears robust when compared to sputtering global data. In addition, a rate hike now, with global yields low and heading negative, would cause exceeding tightening objectives as capital floods into US assets. We continue to fade USD rallies and see the current bullish momentum as closing long positions in illiquid markets (exaggerating moves), rather than a sentiment shift.
EUR/USD – Dollar’s Sell-Off Continues. 

The Risk Today
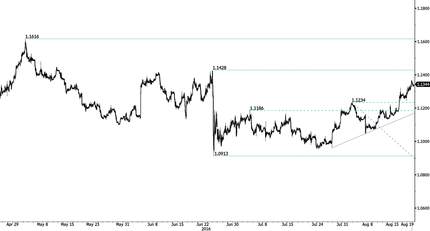
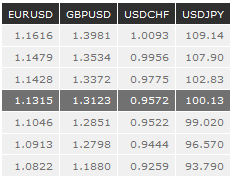
EUR/USD continues to increase after breaking hourly resistance at 1.1234 (02/08/2016 low). Buying pressures are important. Strong resistance is given at 1.1428 (23/06/2016 high). Hourly support can be found at 1.1046 (05/08/2016 low). Expected to further increase. In the longer term, the technical structure favours a very long-term bearish bias as long as resistance at 1.1714 (24/08/2015 high) holds. The pair is trading in range since the start of 2015. Strong support is given at 1.0458 (16/03/2015 low). However, the current technical structure since last December implies a gradual increase.
GBP/USD is increasing despite the medium-term bearish momentum is lively. The pair is testing hourly resistance at 1.3097 (08/08/2016 high). Expected to head towards support given at 1.2798 (06/07/2016 low). The long-term technical pattern is even more negative since the Brexit vote has paved the way for further decline. Long-term support given at 1.0520 (01/03/85) represents a decent target. Long-term resistance is given at 1.5018 (24/06/2015) and would indicate a long-term reversal in the negative trend. Yet, it is very unlikely at the moment.
USD/JPY is bouncing around the 100-mark. Strong support given at 99.02 (24/06/2016 low). Hourly resistance is given at 102.83 (02/08/2016 high). Selling pressures should continue. We favour a long-term bearish bias. Support is now given at 96.57 (10/08/2013 low). A gradual rise towards the major resistance at 135.15 (01/02/2002 high) seems absolutely unlikely. Expected to decline further support at 93.79 (13/06/2013 low).
USD/CHF is trading lower. The pair is going towards support 0.9522 (23/06/2016 low). Hourly resistance can be found at 0.9659 (09/08/2016 high). Expected to further weaken. In the long-term, the pair is still trading in range since 2011 despite some turmoil when the SNB unpegged the CHF. Key support can be found 0.8986 (30/01/2015 low). The technical structure favours nonetheless a long term bullish bias since the unpeg in January 2015.
Resistance and Support:

