Get 40% Off
👀 👁 🧿 All eyes on Biogen, up +4,56% after posting earnings. Our AI picked it in March 2024.
Which stocks will surge next?
Unlock AI-picked Stocks

GBP/USD Ready For Another Leg Down

Published 12/28/2016, 05:50 AM
Updated 05/14/2017, 06:45 AM

The week between Christmas and New Years Eve is not usually the best time to trade. Especially for the traders looking for high volatility, but it definitely has some advantages. The most important one for me is the fact that the macro calendar is almost empty and movements on the market are mostly technical and are not interfered by surprises from the fundamental analysis.

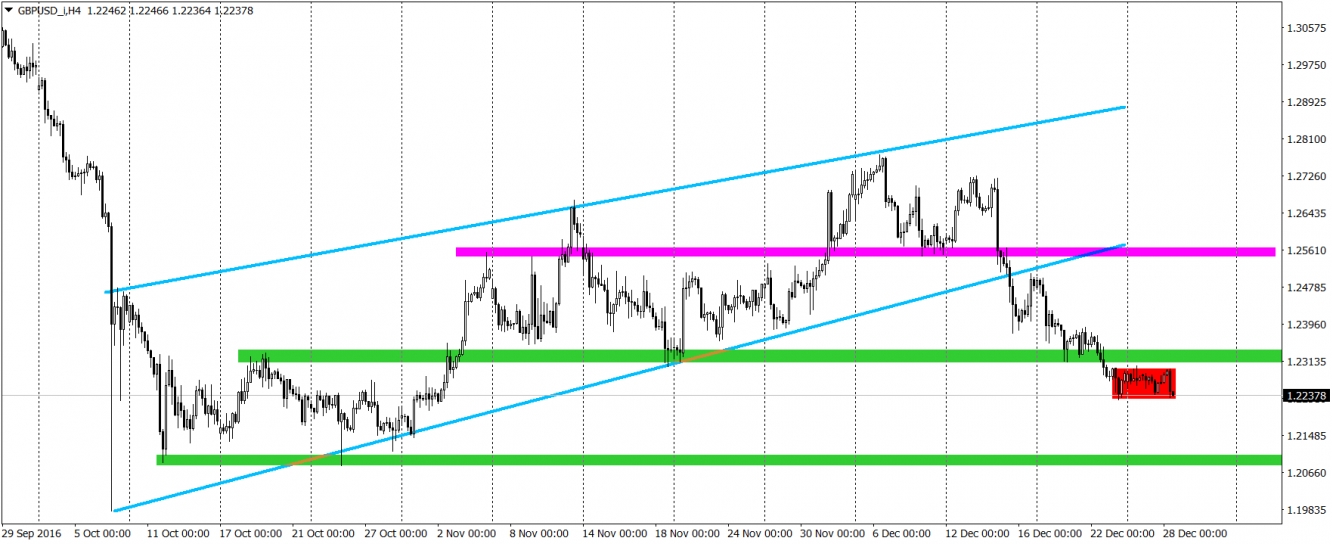
That being said, lets check the situation on the Cable, which from the beginning of December is very bearish. Although in that time, price already declined over 500 pips, we still have a potential for more. To be precise, we still should see at least 140 pips decline, which makes it a good mid-term opportunity. Why we say that the GBP should go down against the USD?

First of all – the trend. Always stick to the trend. Another thing is the bullish correction (flag-blue lines) seen lately, We broke the lower line of the flag, which ends the bullish retracement and technically forces the price to go lower. What is more, on the way here, we broke two horizontal supports 1.255 and 1.233, which shows that current demand for the sterling is weak.

Now, the price created a rectangle below 1.233 (red area). Rectangle is a trend continuation pattern, so technically we should expect a bearish breakout here and a further downswing. Fall should reach the long-term support from October around the psychological barrier on 1.21 and to this place we have those 140 pips mentioned above. Most factors are showing us that the price should decline.

3rd party Ad. Not an offer or recommendation by Investing.com. See disclosure here or remove ads .

Even if you do not believe in Brexit (like me) you cannot argue with the technical analysis here. Maybe in the long-term, sterling will rebound but for now, it looks like we should see it lower. GBP/USD 4 Hour Chart

Latest comments

Risk Disclosure: Trading in financial instruments and/or cryptocurrencies involves high risks including the risk of losing some, or all, of your investment amount, and may not be suitable for all investors. Prices of cryptocurrencies are extremely volatile and may be affected by external factors such as financial, regulatory or political events. Trading on margin increases the financial risks.
Before deciding to trade in financial instrument or cryptocurrencies you should be fully informed of the risks and costs associated with trading the financial markets, carefully consider your investment objectives, level of experience, and risk appetite, and seek professional advice where needed.
Fusion Media would like to remind you that the data contained in this website is not necessarily real-time nor accurate. The data and prices on the website are not necessarily provided by any market or exchange, but may be provided by market makers, and so prices may not be accurate and may differ from the actual price at any given market, meaning prices are indicative and not appropriate for trading purposes. Fusion Media and any provider of the data contained in this website will not accept liability for any loss or damage as a result of your trading, or your reliance on the information contained within this website.
It is prohibited to use, store, reproduce, display, modify, transmit or distribute the data contained in this website without the explicit prior written permission of Fusion Media and/or the data provider. All intellectual property rights are reserved by the providers and/or the exchange providing the data contained in this website.
Fusion Media may be compensated by the advertisers that appear on the website, based on your interaction with the advertisements or advertisers.
© 2007-2024 - Fusion Media Limited. All Rights Reserved.