Get 40% Off
⚠ Earnings Alert! Which stocks are poised to surge?
See the stocks on our ProPicks radar. These strategies gained 19.7% year-to-date.
Unlock full list

GBP/USD, EUR/JPY Fibonacci Retracement Analysis

Published 10/21/2020, 07:06 AM
Updated 07/09/2023, 06:32 AM

GBP/USD

As we can see in the H4 chart, the previous rising wave has transformed into a new sideways correction between 23.6% and 50.0% fibo. Possibly, GBP/USD may yet resume growing towards 61.8% fibo at 1.3174 and then 76.0% fibo at 1.3288. Such a movement will signal further growth to reach the high at 1.3482. However, there is another scenario that implies further decline to break the low at 1.2675 but it’s very unlikely.
GBPUSD_H4
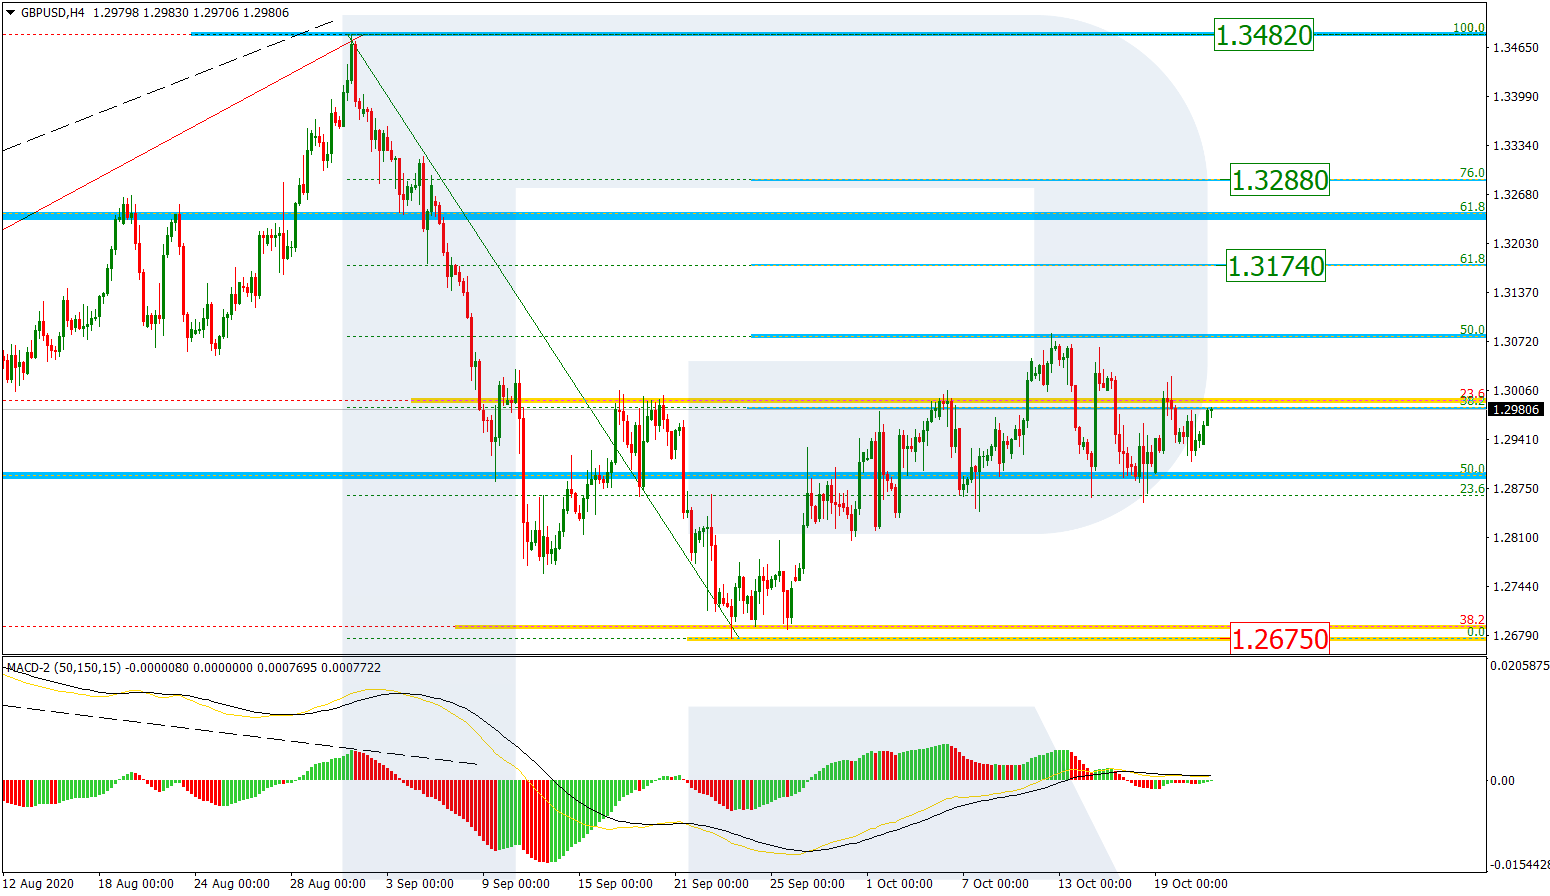
In the H1 chart, a local divergence on MACD made the pair fall and attempt to test 50.0% fibo several times. However, after each test, the asset has failed to update both local highs and the key high at 1.3083, thus hinting at further decline towards 61.8% fibo at 1.2831. If the instrument breaks the resistance at 1.3083, the correction will be over.
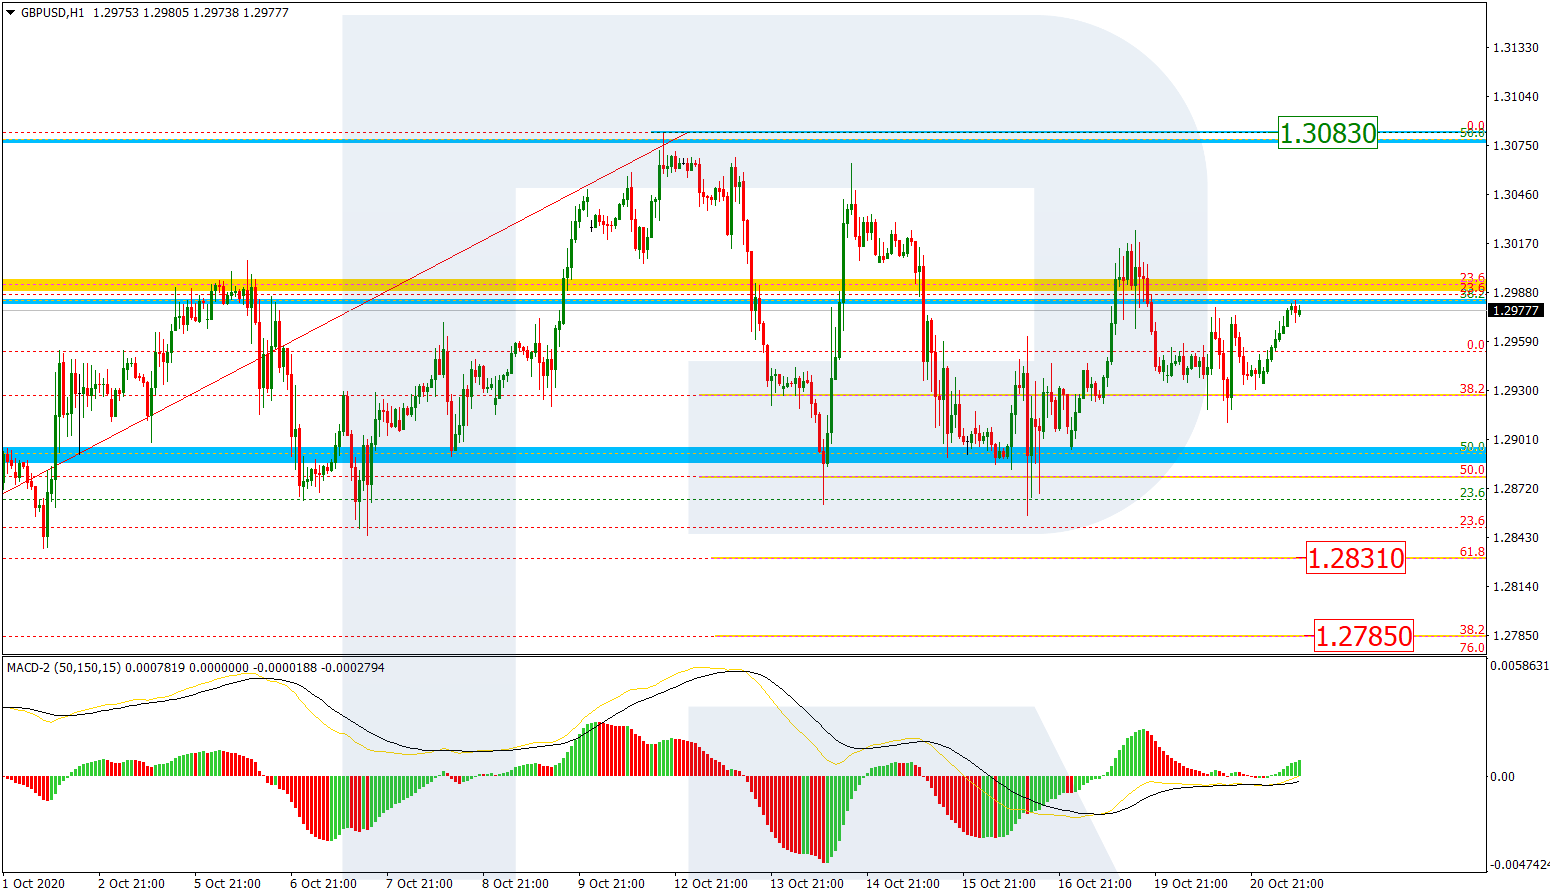
GBPUSD_H1

EUR/JPY

As we can see in the H4 chart, after finishing the descending wave, the asset is forming a new rising impulse, which may later transform into a proper wave to break the high at 127.07 and then continue towards the long-term 61.8% fibo at 128.65. However, to confirm this scenario, the market must break 61.8% and 76.0% fibo at 125.29 and 125.94 respectively. If it fails, EUR/JPY may form another mid-term descending wave to break the low at 122.38 and then continue falling to reach 61.8% and 76.0% fibo at 122.28 and 121.18 respectively.
EURJPY_H4
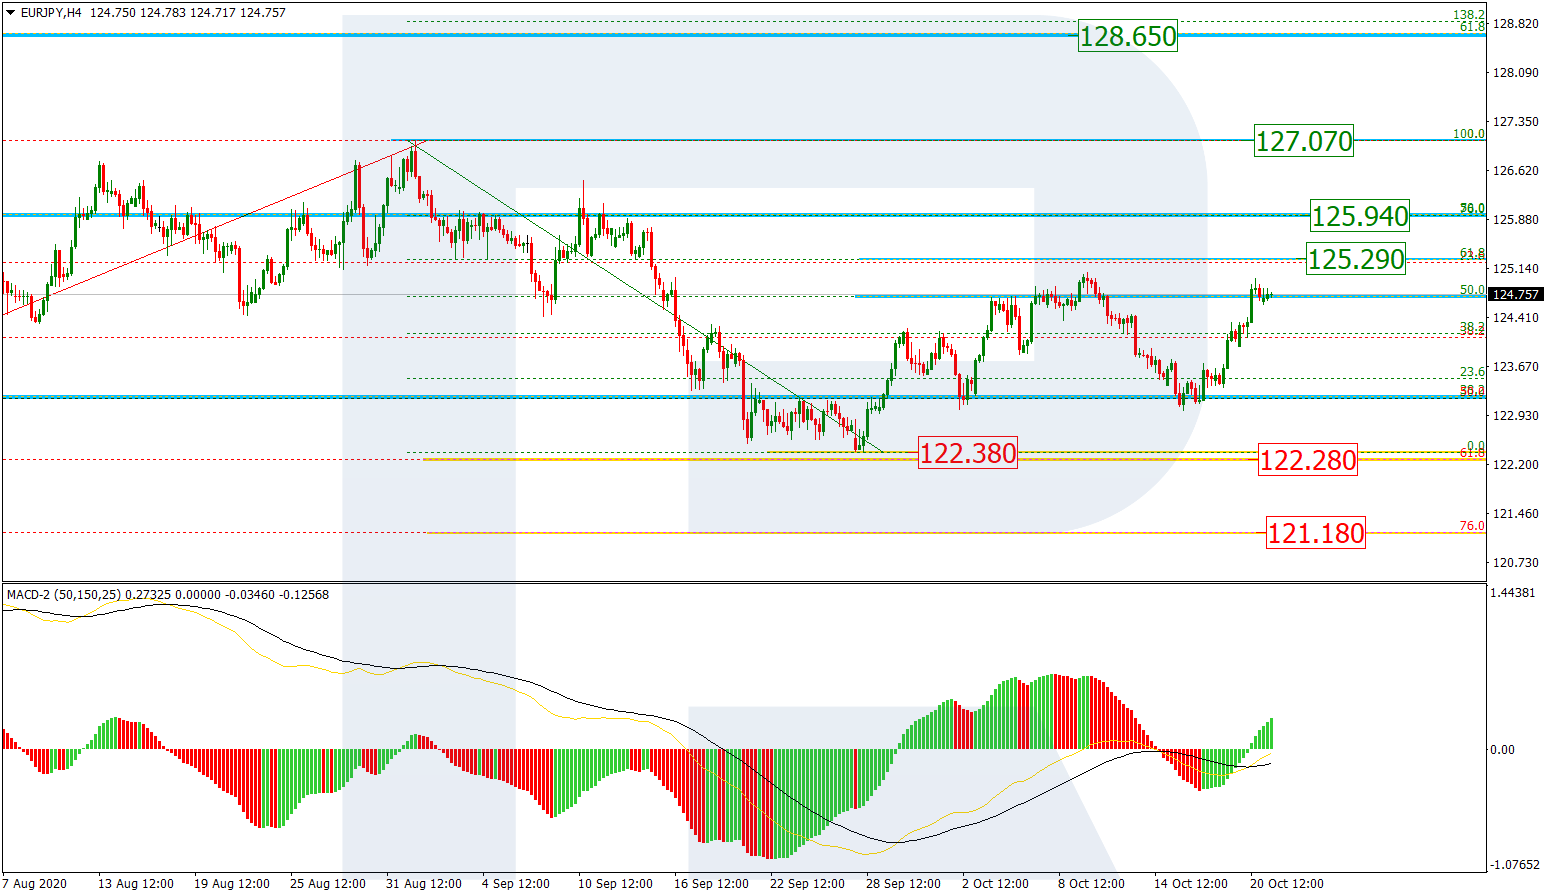
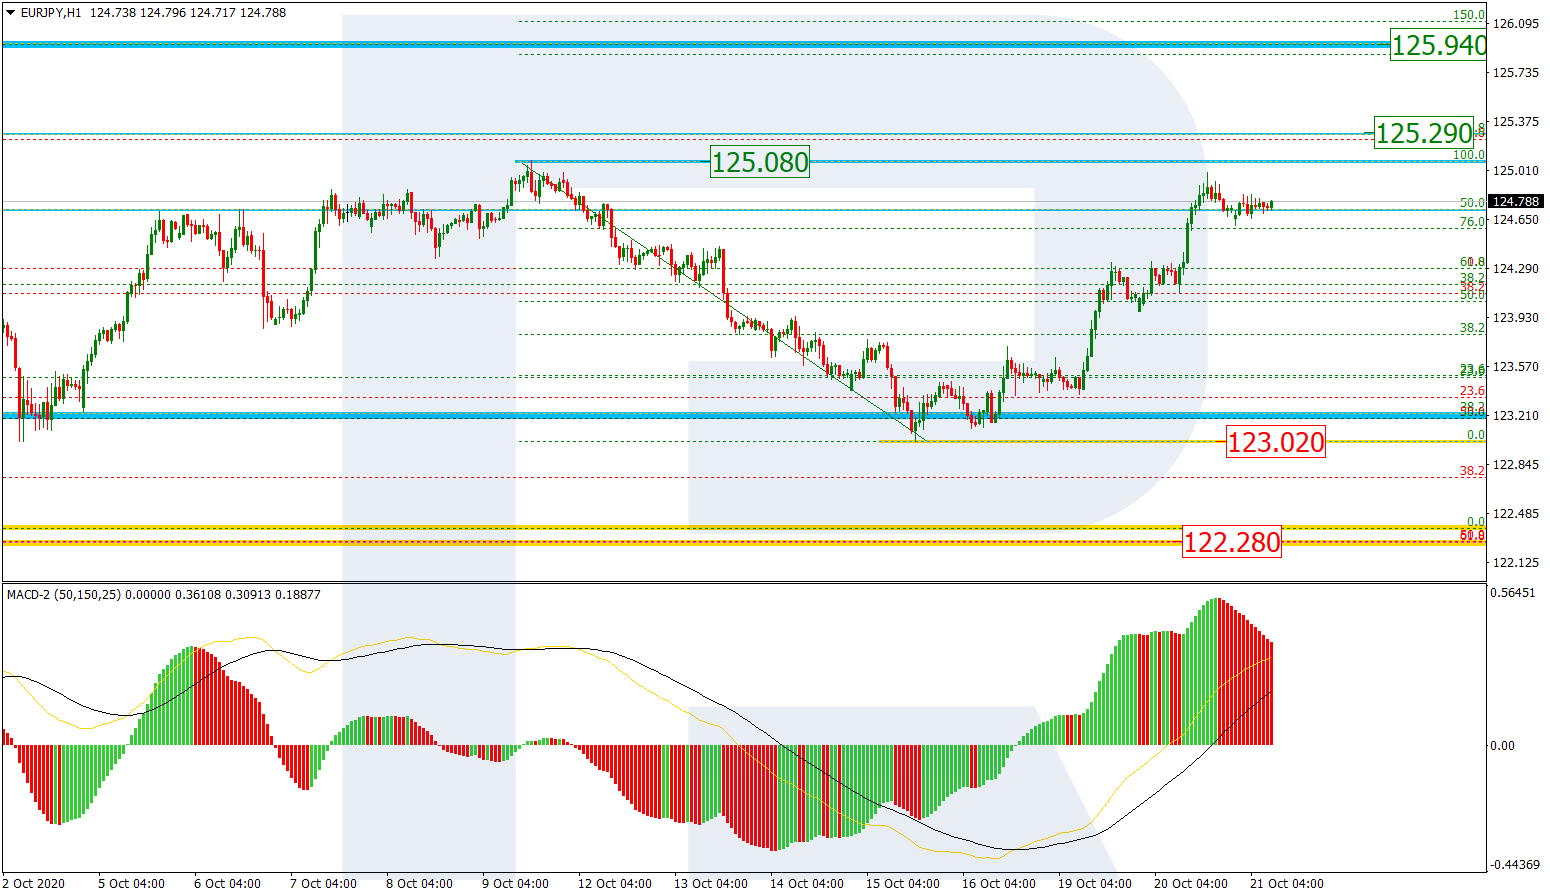
In the H1 chart, the pair has reached the local high at 125.08. After breaking it, the instrument may continue growing towards 61.8% and 76.0% fibo at 125.29 and 125.94 respectively. The local support is the low at 123.02.
EURJPY_H1

Latest comments

Risk Disclosure: Trading in financial instruments and/or cryptocurrencies involves high risks including the risk of losing some, or all, of your investment amount, and may not be suitable for all investors. Prices of cryptocurrencies are extremely volatile and may be affected by external factors such as financial, regulatory or political events. Trading on margin increases the financial risks.
Before deciding to trade in financial instrument or cryptocurrencies you should be fully informed of the risks and costs associated with trading the financial markets, carefully consider your investment objectives, level of experience, and risk appetite, and seek professional advice where needed.
Fusion Media would like to remind you that the data contained in this website is not necessarily real-time nor accurate. The data and prices on the website are not necessarily provided by any market or exchange, but may be provided by market makers, and so prices may not be accurate and may differ from the actual price at any given market, meaning prices are indicative and not appropriate for trading purposes. Fusion Media and any provider of the data contained in this website will not accept liability for any loss or damage as a result of your trading, or your reliance on the information contained within this website.
It is prohibited to use, store, reproduce, display, modify, transmit or distribute the data contained in this website without the explicit prior written permission of Fusion Media and/or the data provider. All intellectual property rights are reserved by the providers and/or the exchange providing the data contained in this website.
Fusion Media may be compensated by the advertisers that appear on the website, based on your interaction with the advertisements or advertisers.
© 2007-2024 - Fusion Media Limited. All Rights Reserved.