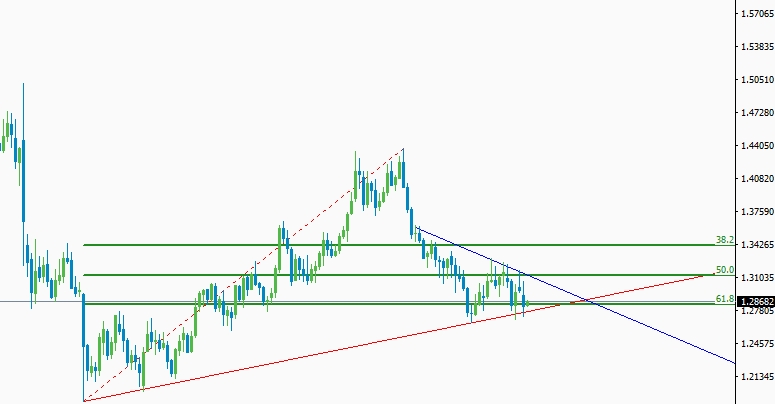
There has been a decent fall in the GBP/USD pair after it hit the major resistance level at 1.43511. From that level, the pair has started its bearish rally and found some decent support at 1.27570. Majority of the short-term traders had made a decent profit by executing long orders at the trend line support at 1.27570. Though the setups in the daily chart seem extremely convincing for the executing long orders the weekly chart reveals a clear formation of triangle chart pattern. Unless we have a clear breakout, the traders are advised to place a trade in favor of the long-term downtrend. GBP/USD technical chart analysis
Figure: GBP/USD bounces off from trend line support
From the above figure, you can clearly see the bulls are trying to take control of this market. But the recent bearish pressure seems to outrun the bulls which may eventually result in a bearish breakout of the triangle pattern. The professional traders in the CFD trading industry are cautiously waiting in the sideline for a clear breakout to execute trades.
If the pair bulls manage to surge higher from trend line support zone at 1.27570, we will see another retest of the triangle pattern resistance at 1.30720. The short-term traders might look for bearish price action confirmation signal to execute short orders but trading the market at such a narrow range is not advisable unless you have extensive trading experience. A clear break of the price above the critical resistance level at 1.30720 will eventually lead this pair towards the next critical resistance level at 1.31310. This level is going to provide a significant amount of selling pressure to the GBP/USD pair but a daily closing of the price above that level will confirm the bullish breakout of the currency triangle pattern. Once the pair manages to clear the critical resistance level at 1.31310, the bulls are most likely to challenge the major resistance level at 1.43609. This level is going to play a vital role since lots of traders will be shorting the GBP/USD pair upon the formations of bearish price action signal. However, a clear break of the price above the high of 8th April 2018 will confirm the end of an extended bearish rally in the GBP/USD pair.
On the downside, we need to break below the major support level at 1.27177 to see some fresh selling pressure in the market. The first bearish target for the GBP/USD pair would be the major support level at 1.25800. From that level, we might see some ranging market as we have plenty of supportive candles just below this level. However, the daily closing of the price below that support level will result in a sharp decline which will eventually lead this pair towards the next major support level at 1.19109. This level is going to play a vital role for the long-term bulls and any bullish price action signal will be an excellent opportunity to make a profit on a bullish retracement.
Fundamental factors
Fundamentally, the recent performance of the British Economy is not up to the market. Moreover, the unclear statement from the MPC officials is also rising doubt into the mind of long-term investors. On the contrary, the U.S dollar index which measures the overall value of the green buck’s strength against six major currency pairs is failing to establish its bullish momentum in the global market. If the FED officials come with the hawkish rate hike, we might see some strong surge in the U.S dollar index which will eventually push the price of GBP/USD pair significantly lower. But a rate hike a dovish tone is most like to weaken the U.S dollar against its major rivals in the long-term scenario. Considering the fundamental factors, the overall market condition for the GBP/USD pair is still unclear.
