
Less than two weeks ago, GBP/NZD was hovering near 1.9160, following recovery from as low as 1.8127. After a 10-figure rally in just a month and a half, the bulls were getting more and more confident in their ability to keep pushing the pair higher.
Unfortunately for them, the market was already sending a bearish message in the form of a complete Elliott wave cycle. On January 23, we devoted a whole article to that pattern, including the chart below.

An Elliott Wave cycle consists of two parts. The first part, or phase, is a five-wave impulse, which points in the direction of the larger trend. The second part is a three-wave correction, which moves against the preceding impulse.
In GBP/NZD’s case, the recovery from 1.8127, marked as wave (2), followed a five-wave decline from as high as 2.0470, labeled wave (1). According to the theory, it was time for the pair to head south again in wave (3).
However, picking tops is not worth the risk. The price can always rise a little higher before the reversal actually occurs. So we thought “traders should wait for a breach of the support line drawn through the lows of waves (1) and “b” of (2) before joining the bears in GBP/NZD.” Then this happened:
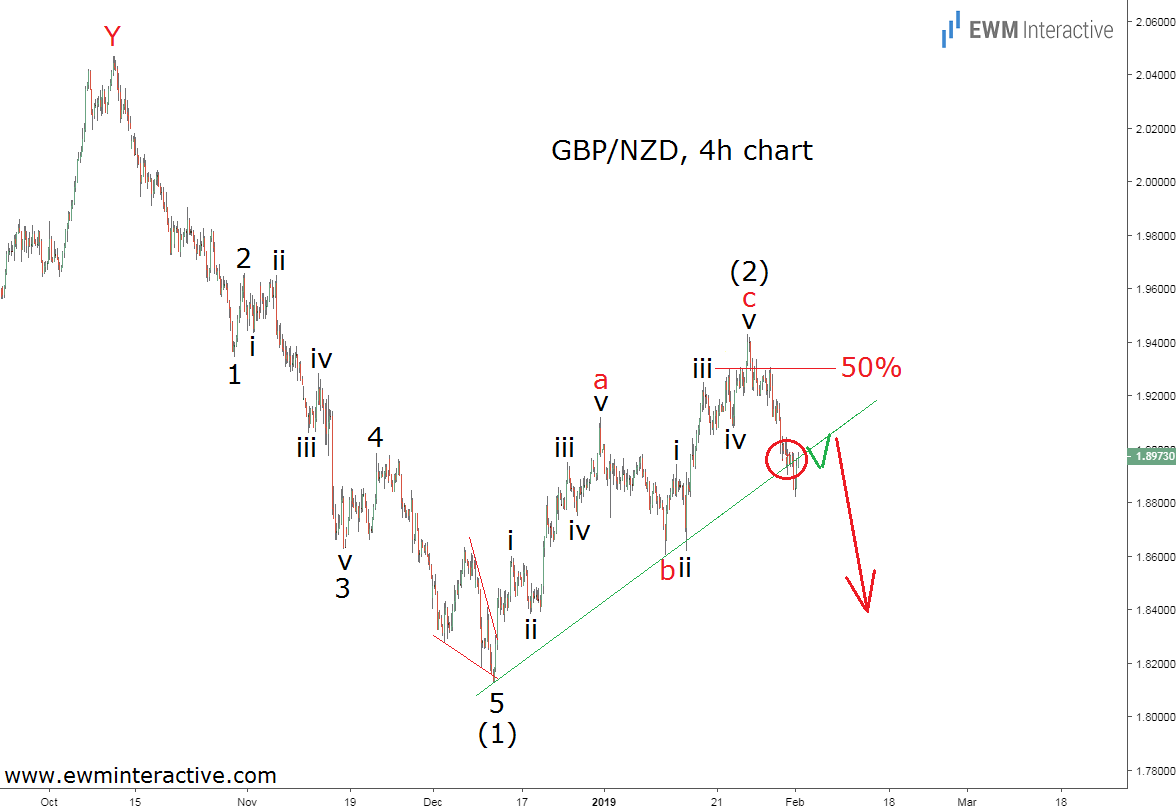
GBP/NZD climbed a little further before giving up. 1.9428 turned out to be the exact point of the bears’ return. On Thursday, January 31, the pair finally breached the support line drawn through the last two lows. The next day, February 1st, the rate dropped to 1.8822.
What Lies Ahead for GBP/NZD?
So far, everything has been going according to plan. But instead of accelerating to the south after the breakout, GBP/NZD started recovering. The bulls managed to take 150 pips back from the bears and closed last week’s session at 1.8973.
In order to find out what Friday’s leap means, we have to take a look at the wave structure of the decline from 1.9428 to 1.8822.
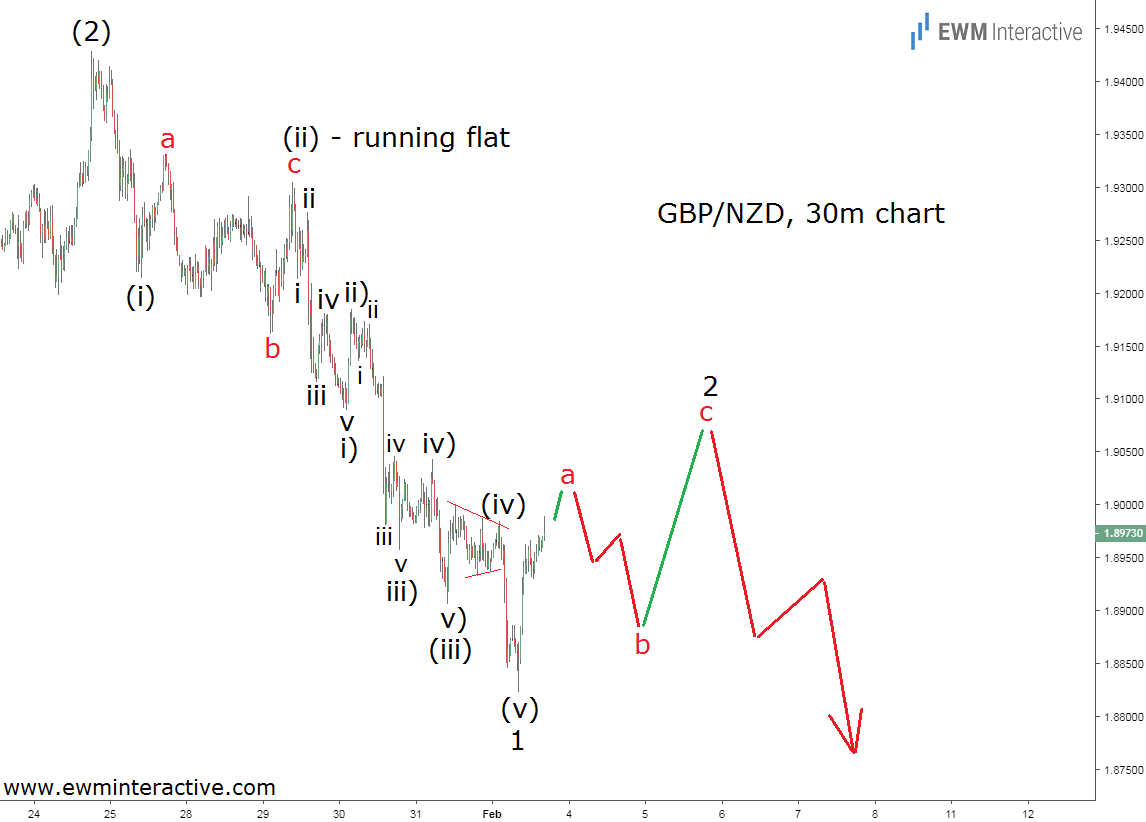
The 30-minute chart further confirms the long-term bearish outlook. It reveals that the recent weakness has taken the shape of a five-wave impulse. It appears 1.8822 marks the end of wave 1 of (3), whose sub-waves can be labeled (i)-(ii)-(iii)-(iv)-(v).
The sub-waves of the wave (iii) are clearly visible, and if we take a closer look, the impulsive structure of waves i) and iii) of (iii) can be seen, as well. Wave (ii) is a running flat correction, while wave (iv) is a triangle.
This pattern means that Friday’s rally to 1.8989 should be part of the corresponding three-wave retracement in wave 2. GBP/NZD can be expected to reach 1.9100 in wave 2, but as long as it trades below the starting point of wave 1 at 1.9428, the big picture bearish count remains intact.