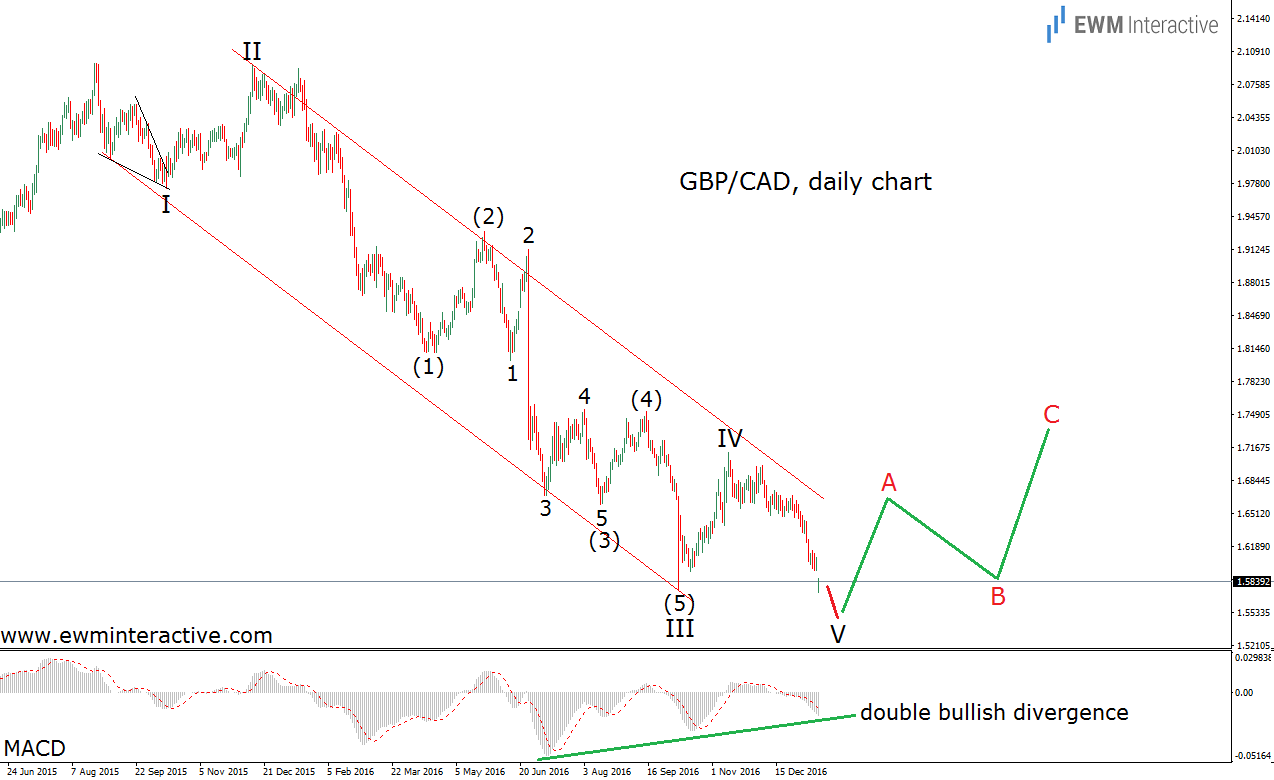
The last time we wrote about GBP/CAD was almost half a year ago. On January 16th, 2017, the pair was hovering around its lowest level since July, 2013, after a decline from 2.0972 to as low as 1.5736. Usually, trading in the direction of the larger trend is a good strategy. Except when it is not. Traders had all the reasons to trust the bears, since they have been in charge for 14 months already, and open short positions in GBP/CAD near 1.5740.
Unfortunately, no trend lasts forever, and the pound’s downtrend against the Canadian dollar is no exception. Instead of continuing further to the south, the pair undertook a significant surge lifting it to 1.7852 three months later. GBP/CAD might have left trend-following traders scratching their heads, but to Elliott Wave analysts, the rate’s rally did not come out of the blue. The chart below shows how the Elliott Wave Principle managed to warn us about the bullish reversal six months ago.
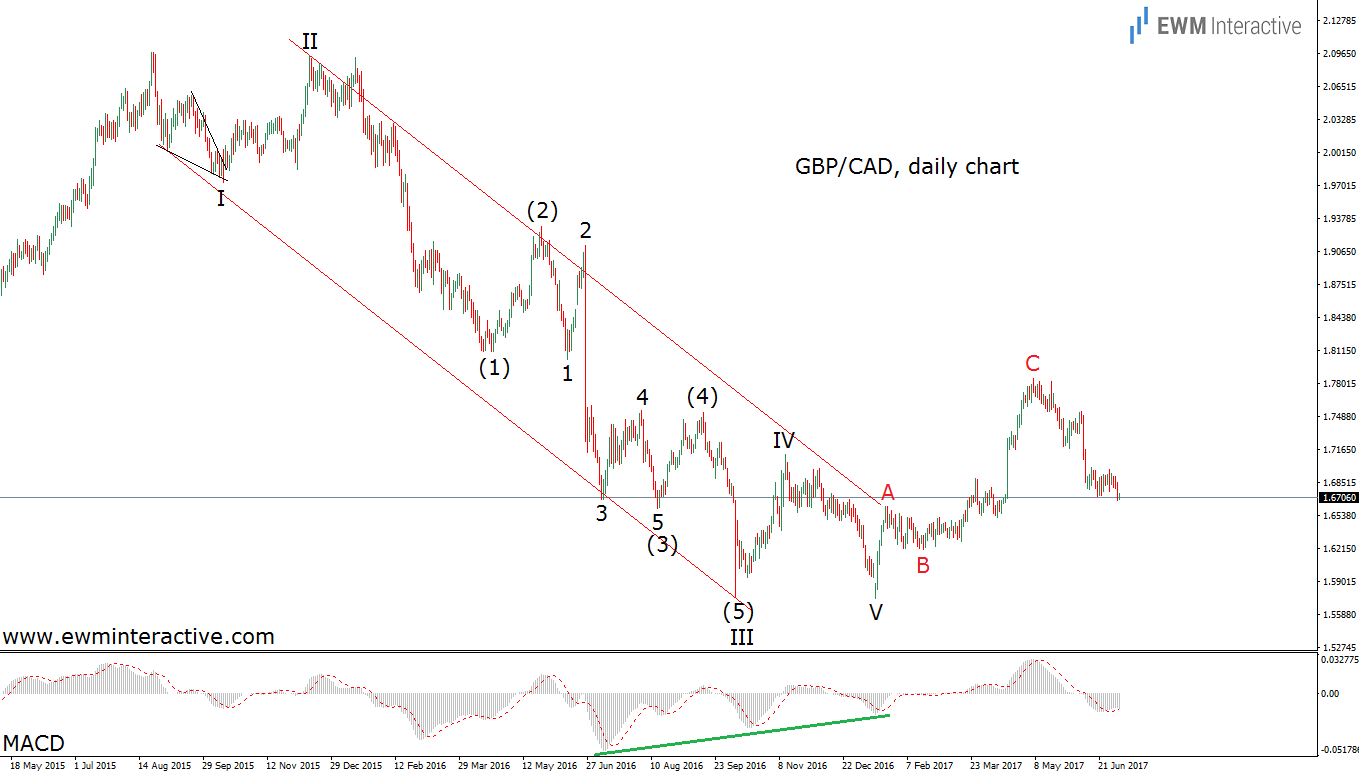
This chart was published in “GBP/CAD Threatens to Kill Late Bears’ Profits”. It shows that the decline in question was actually a complete five-wave impulse. According to the theory, every impulse is followed by a three-wave correction in the other direction. Also, the MACD indicator was flashing a double bullish divergence between the last three lows. These were two solid technical reasons not to sell near 1.5740. Today is July 5th, 2017, and the daily chart of GBPCAD looks like this:

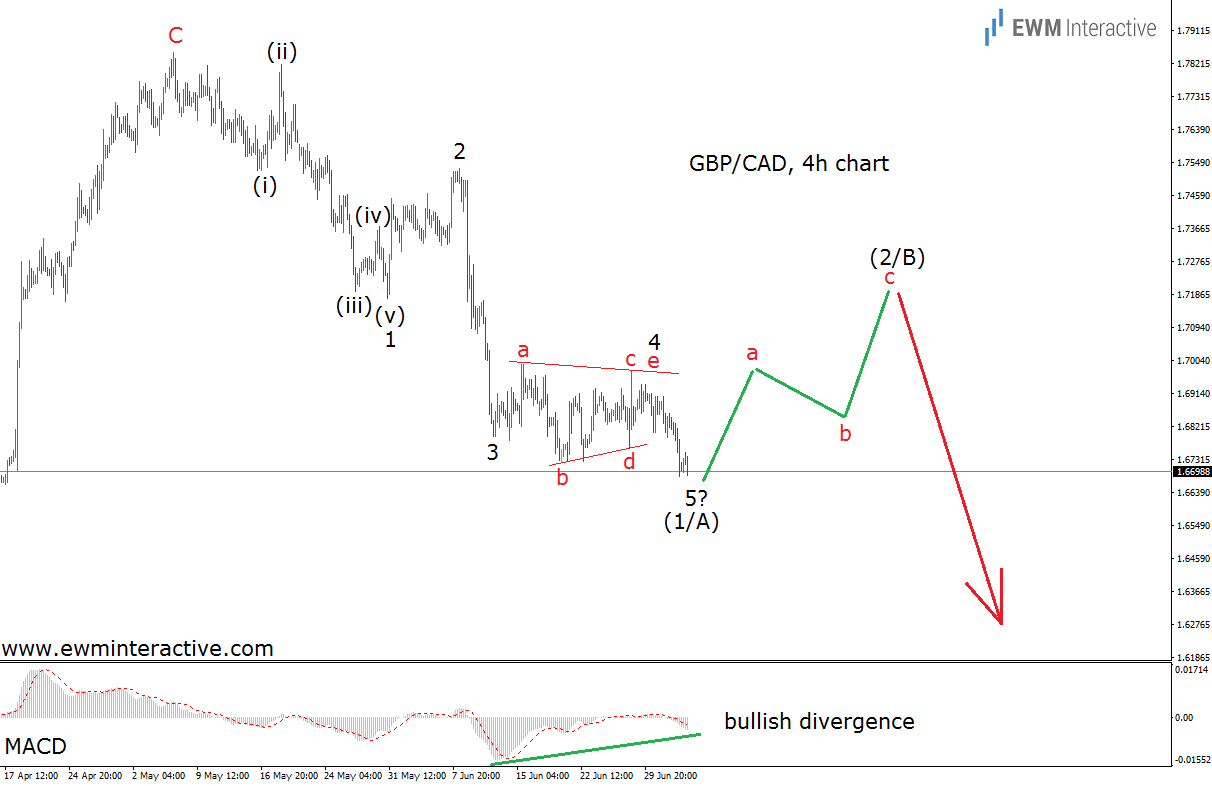
Actually, the anticipated three-wave recovery began the very same day. Between January 16th and May 5th, GBP/CAD added 2116 pips. Apparently, Brexit woes do not matter, if they coincide with the bullish phase of the wave cycle. However, after reaching its May top, the pair reversed to the downside again and is trading around 1.6730 as of this writing. In order to find out what this means, let’s take a look at the 4-hour chart, which will allow us to see the structure of the recent selloff.
As visible, the current weakness could be seen as a complete impulsive decline, as well. In addition, the MACD indicators is once again showing a bullish divergence between waves 3 and 5. The combination of a complete impulse and a MACD divergence on the pair’s daily chart led to a bullish reversal six months ago. Why should we expect a different outcome now? It is the same exercise.
The 4-hour chart tells us two things. First, the bears have officially returned, because this pattern indicates the direction of the larger trend. And second, the selling right away is not a good idea, because a corrective recovery in wave (2/B) should follow, before the downtrend resumes.
