Get 40% Off
🚨 Volatile Markets? Find Hidden Gems for Serious OutperformanceFind Stocks Now

GBP/CAD Attempting To Break To New Highs – February 16, 2018

Published 02/16/2018, 09:39 AM
Updated 03/21/2024, 07:45 AM

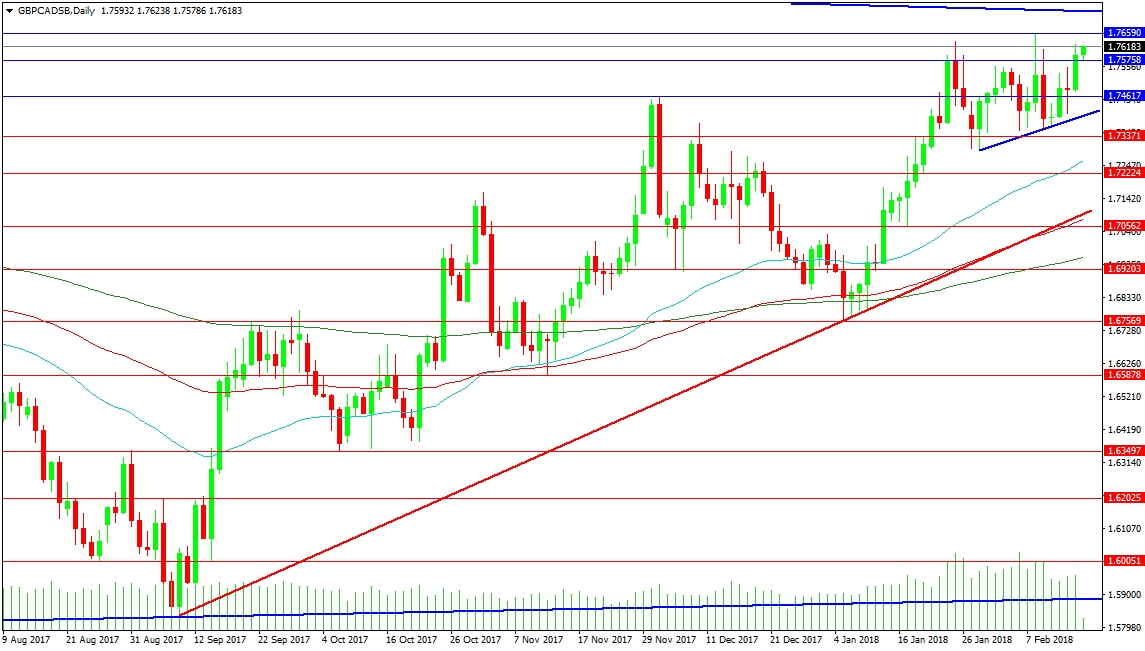
The GBP/CAD pair is currently holding above 1.75000, attempting to break out to new highs above 1.76590. Trendline resistance is at 1.77279, with 1.77500 and 1.77815 further up before 1.78000. Support can be found at the rising blue trend line around 1.74050 and also 1.74617, which is the high from the 1st of December, and the 1.73000 area. The 50-Day MA is rising through 1.72605 but the 100-Day MA is strengthening the red support trend line from the September low at 1.70775. A break under this area would suggest a deeper retracement would take place.

The 200-Day MA is at 1.69589, giving support to the area around 1.70000. Any loss of this supporting zone targets 1.67569 as the most recent major higher low. A push under that level could lead to tests of 1.65878 and 1.63497 as technical supports.

GBP/CAD Daily Chart

USD/JPY

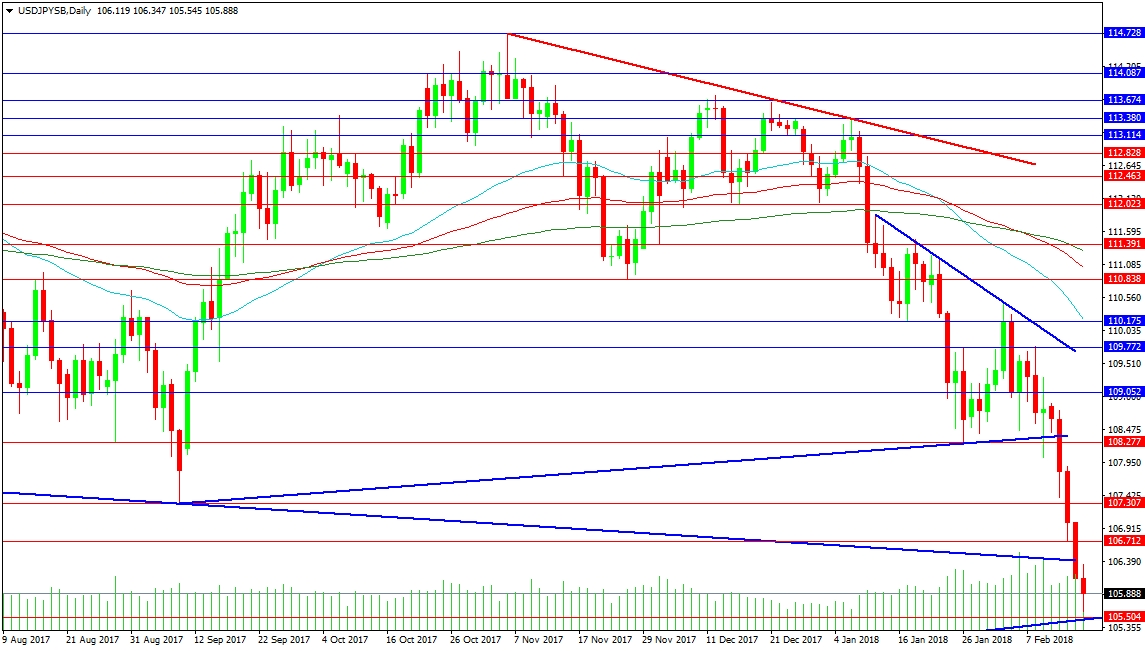
This pair has fallen further overnight as the current Bank of Japan Governor has been reappointed for a second term. The USDs continued weakness has also impacted on price discovery since the start of 2018. On the last trading day of 2017, the price closed at 112.663. It is now trading around 105.890, having been down to 105.545 earlier. There is trend line support below at 105.452, combining with the supporting level of 105.500, which is all adding up to halt the drift lower at the moment. Should this support break then 105.000 can be tested with the 104.440 support further on.

Resistance above the current price level is at the falling blue trend line at 106.383 and the low from Wednesday at 106.712. The September low of 107.310 provides key resistance and a break above could signal a reversal higher. This move would then go on to target 108.277 and the rising blue trend line, with 109.052 above. Before 110.000 can be retested, the 109.700 area has to be broken but by the time price action reaches that zone, the falling moving averages in a daily time frame will have moved lower to provide their own resistive weight to the action.

3rd party Ad. Not an offer or recommendation by Investing.com. See disclosure here or remove ads .

USD/JPY Daily Chart

Latest comments

Risk Disclosure: Trading in financial instruments and/or cryptocurrencies involves high risks including the risk of losing some, or all, of your investment amount, and may not be suitable for all investors. Prices of cryptocurrencies are extremely volatile and may be affected by external factors such as financial, regulatory or political events. Trading on margin increases the financial risks.
Before deciding to trade in financial instrument or cryptocurrencies you should be fully informed of the risks and costs associated with trading the financial markets, carefully consider your investment objectives, level of experience, and risk appetite, and seek professional advice where needed.
Fusion Media would like to remind you that the data contained in this website is not necessarily real-time nor accurate. The data and prices on the website are not necessarily provided by any market or exchange, but may be provided by market makers, and so prices may not be accurate and may differ from the actual price at any given market, meaning prices are indicative and not appropriate for trading purposes. Fusion Media and any provider of the data contained in this website will not accept liability for any loss or damage as a result of your trading, or your reliance on the information contained within this website.
It is prohibited to use, store, reproduce, display, modify, transmit or distribute the data contained in this website without the explicit prior written permission of Fusion Media and/or the data provider. All intellectual property rights are reserved by the providers and/or the exchange providing the data contained in this website.
Fusion Media may be compensated by the advertisers that appear on the website, based on your interaction with the advertisements or advertisers.
© 2007-2024 - Fusion Media Limited. All Rights Reserved.