
Quick Take
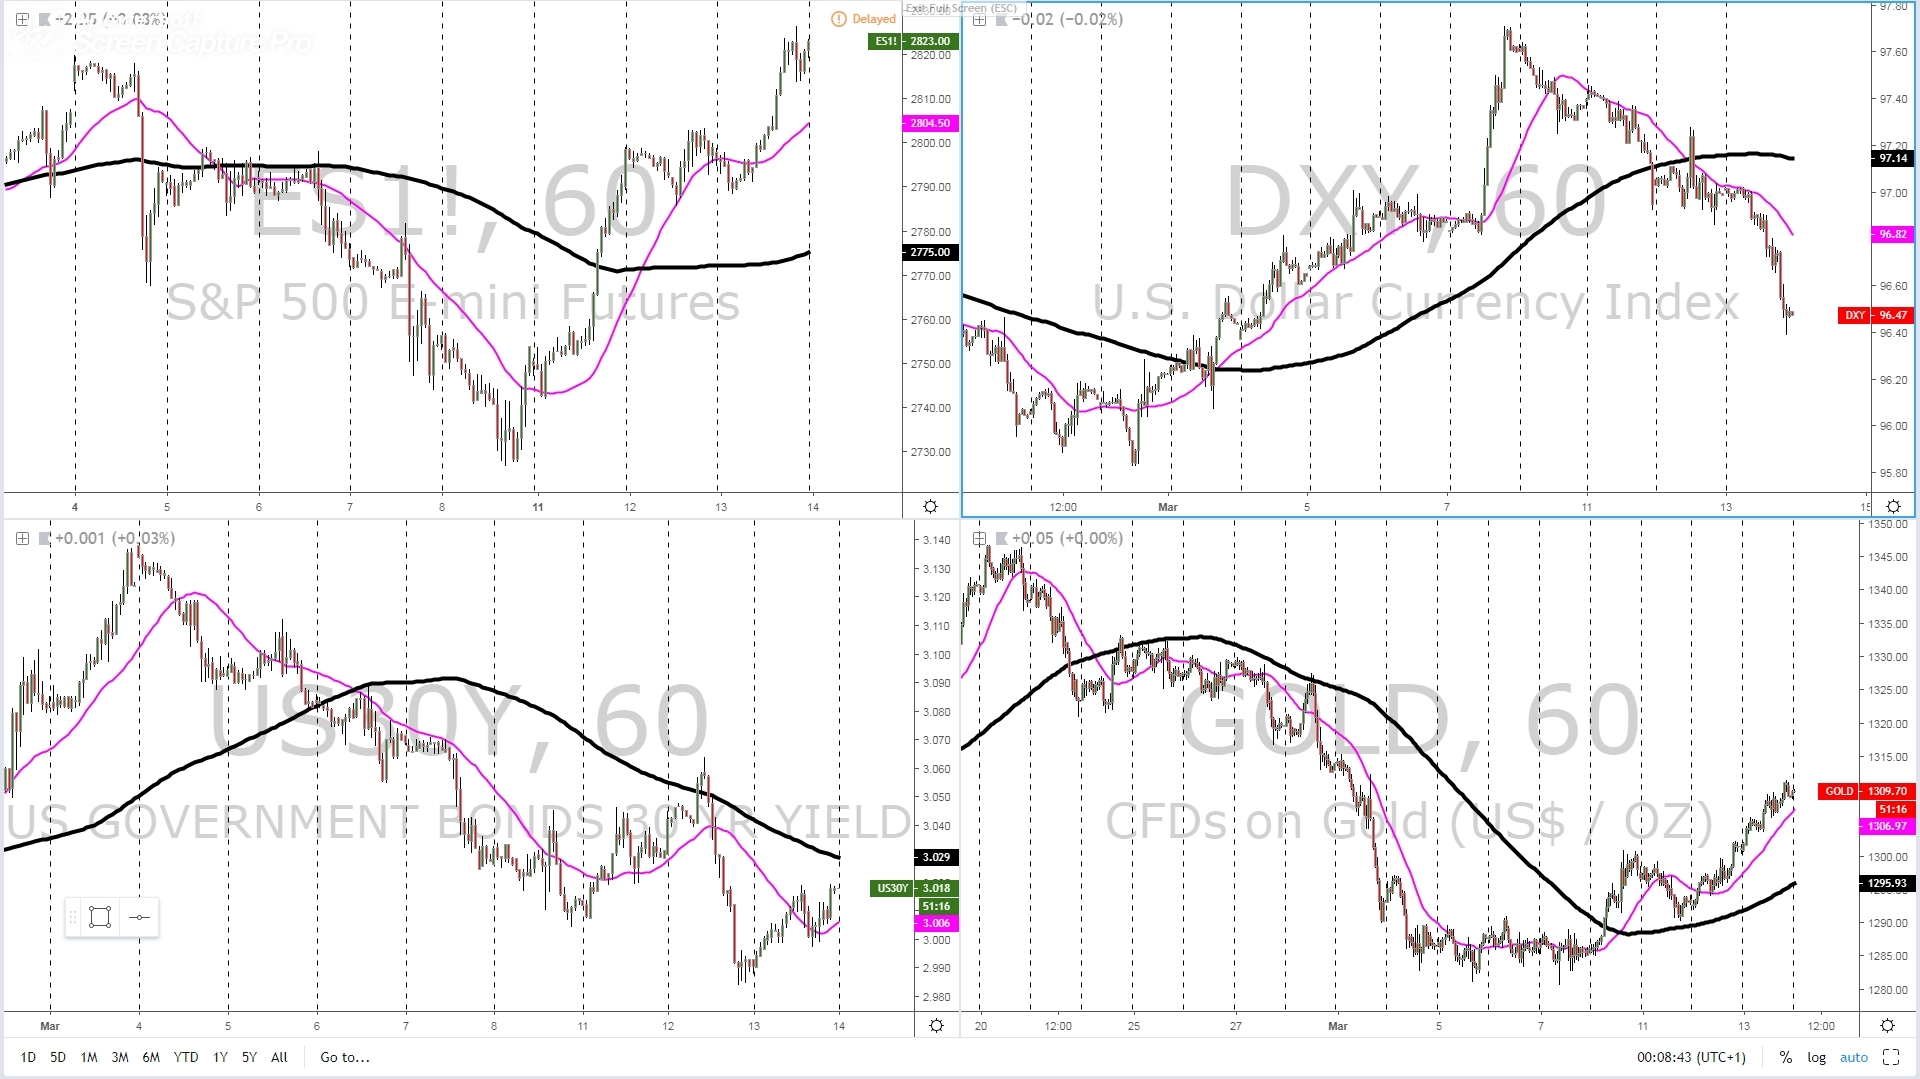
JPY and USD supply flows were the common denominators as the environment turned ‘true risk on’ once again. Further diversification into riskier assets, including beta currencies, has clearly transpired, as the micro and macro slopes of the SP500 vindicate. Interestingly, global yields, taking the US 30-yr as a reference, while marginally higher, continue to exhibit a rather sluggish behavior. Short-term, the environment remains very positive for risk trades, especially for the Canadian dollar, as it takes up the slack from a heavier Aussie, weighted by constant negative fundamentals in Australia (Westpac’s consumer confidence the last disappointment). Meanwhile, the dynamics around the euro have been relatively benign, while the sterling is flying as the UK secures, in theory, the rejection of a ‘no deal’ Brexit after Wednesday’s vote in the Commons.
Dashboard: Intermarket Flows And Technical Analysis
Summary: Intermarket Flows & Technical Analysis
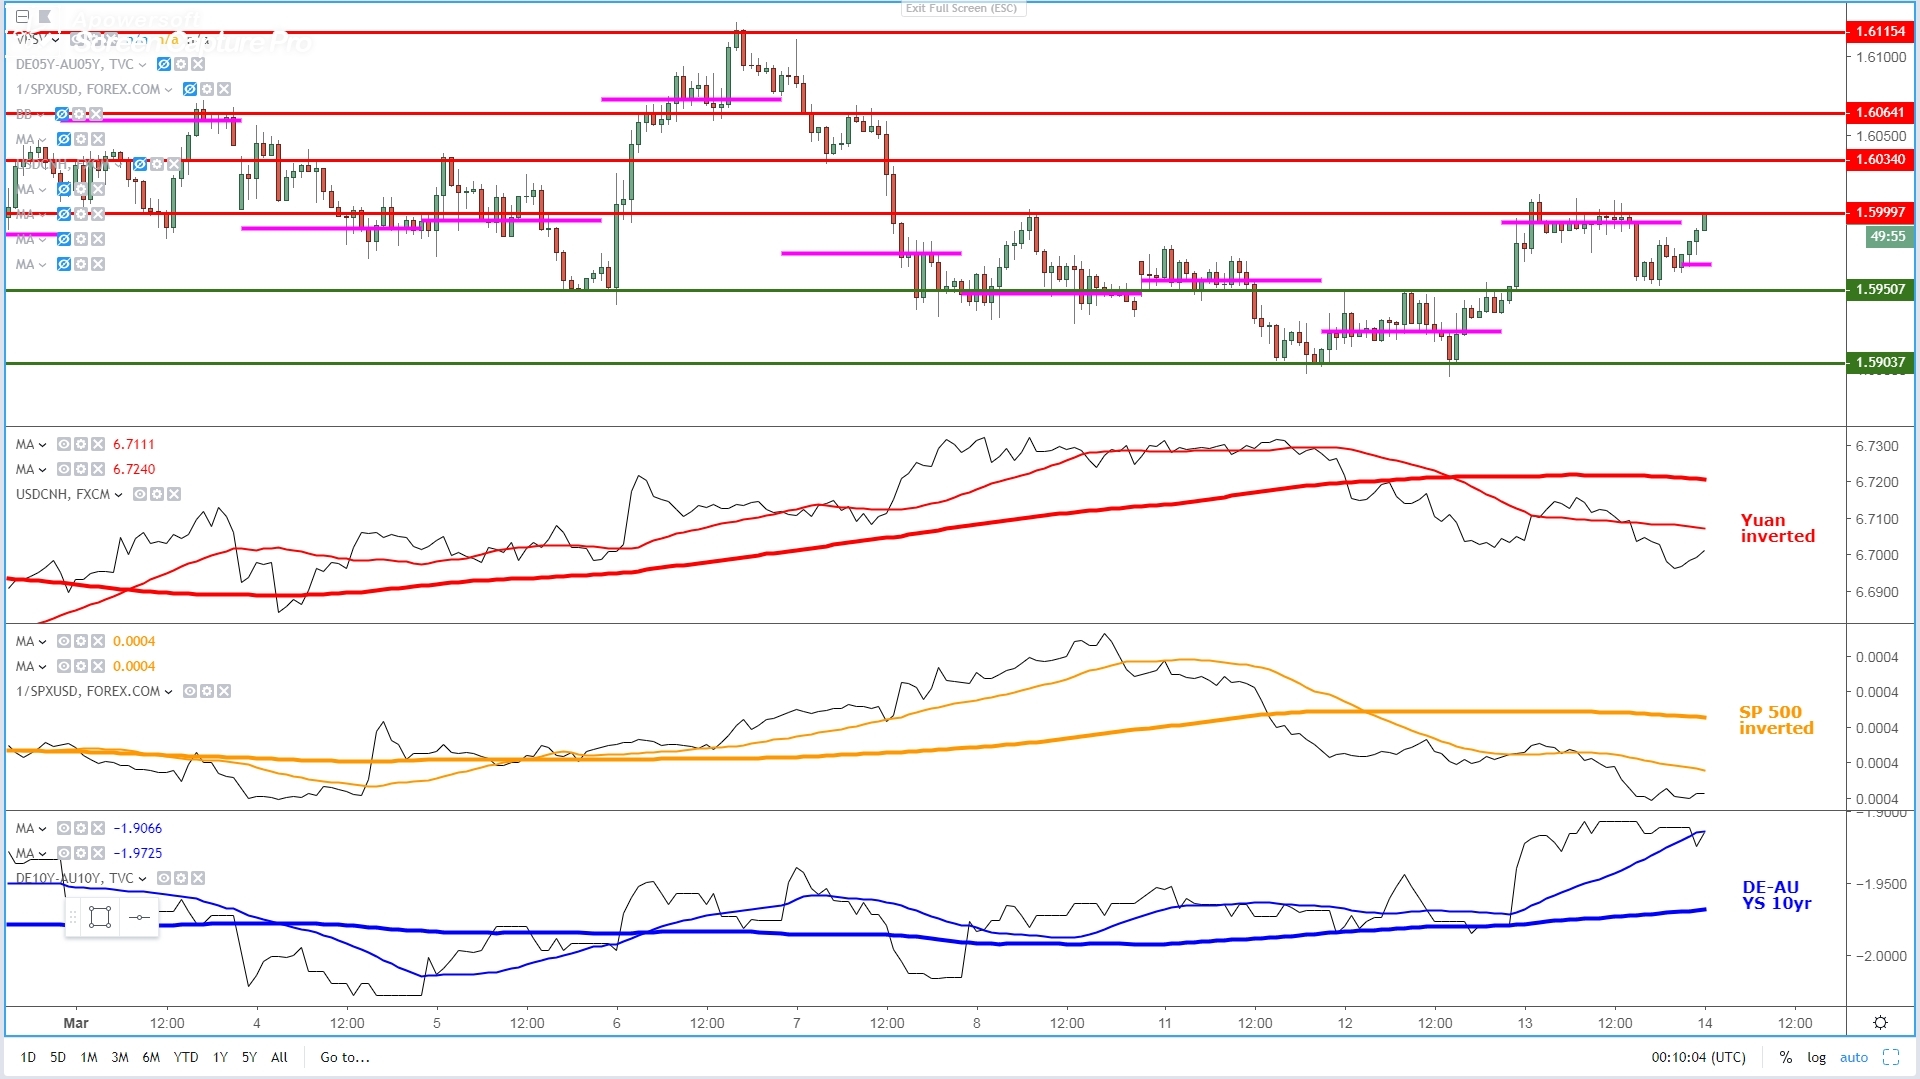
EUR/USD: Buy-Side Flows Dominate On Brexit Delay Speculation
- The euro follows the bullish directional move in the GBP as the market keeps pricing in the avoidance of a ‘no deal’ to leave the EU, removing temporarily the inherited tail risk of Brexit.
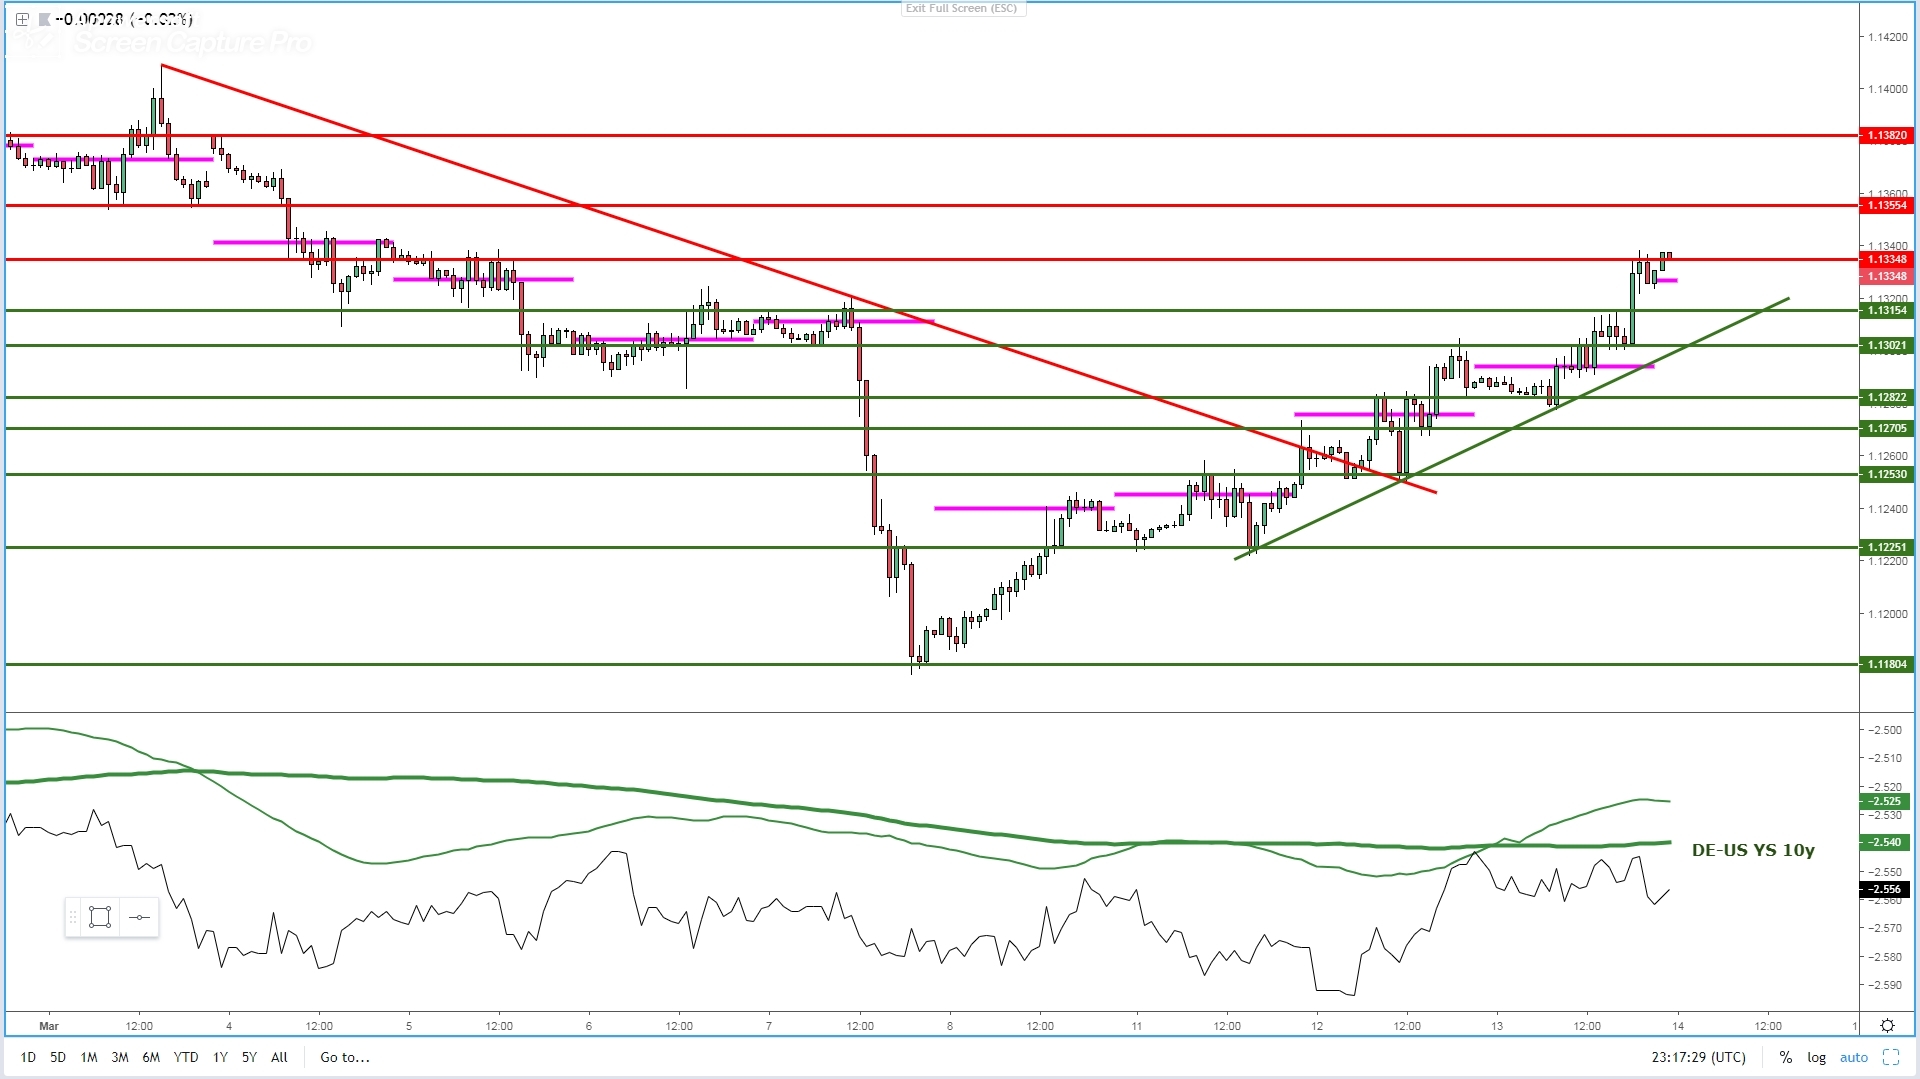
- The latest upthrust buy-side candle on the hourly guns through a sticky resistance above 1.13 with the supply that came post ECB last week left behind after being absorbed.
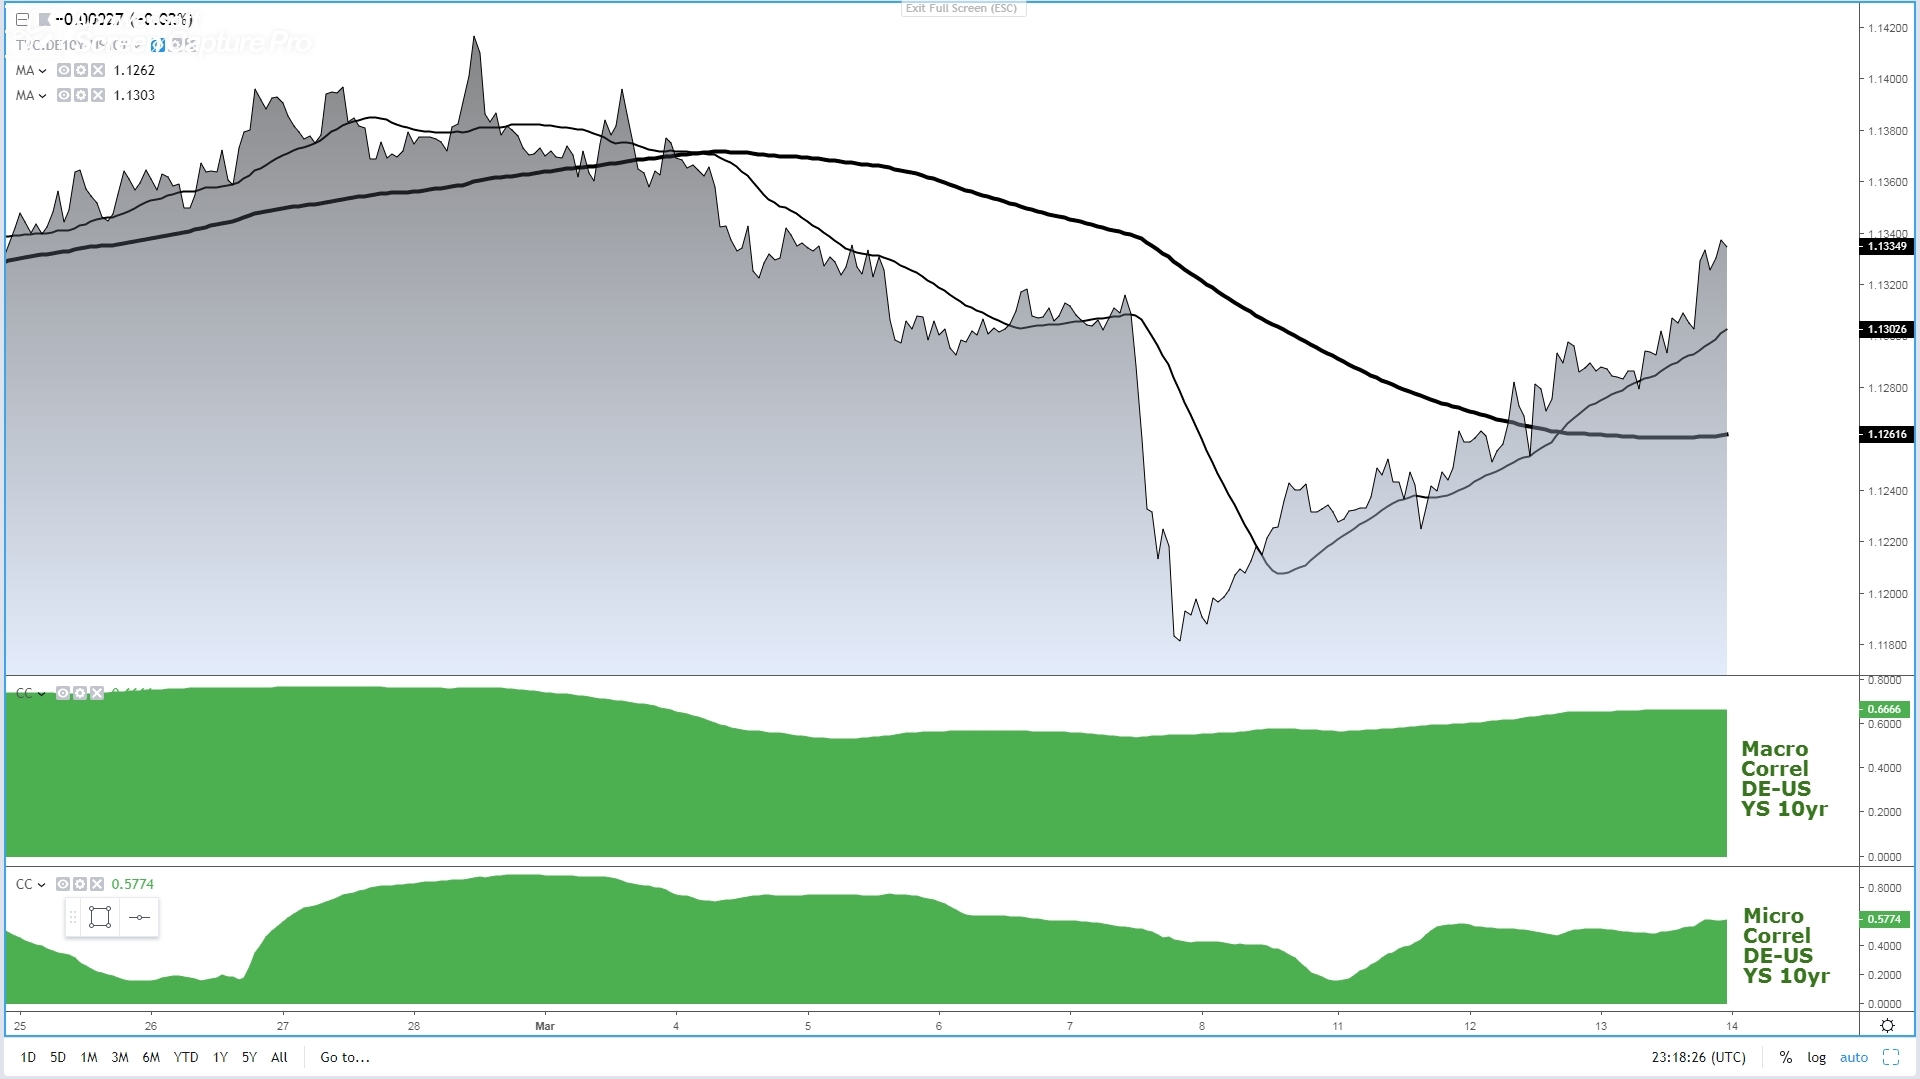
- Technicals and intermarket (German vs US yield spread) continue to be in congruence for an extension to the upside, with the green lines drawn to act as key buy-side zones on retracements.
- The bullish structure of higher highs and higher lows has allowed up to draw an ascending trendline that serves as a visual representation of the benign buy-side dynamics.
GBP/USD: Huge Volatile Swings The Norm This Week
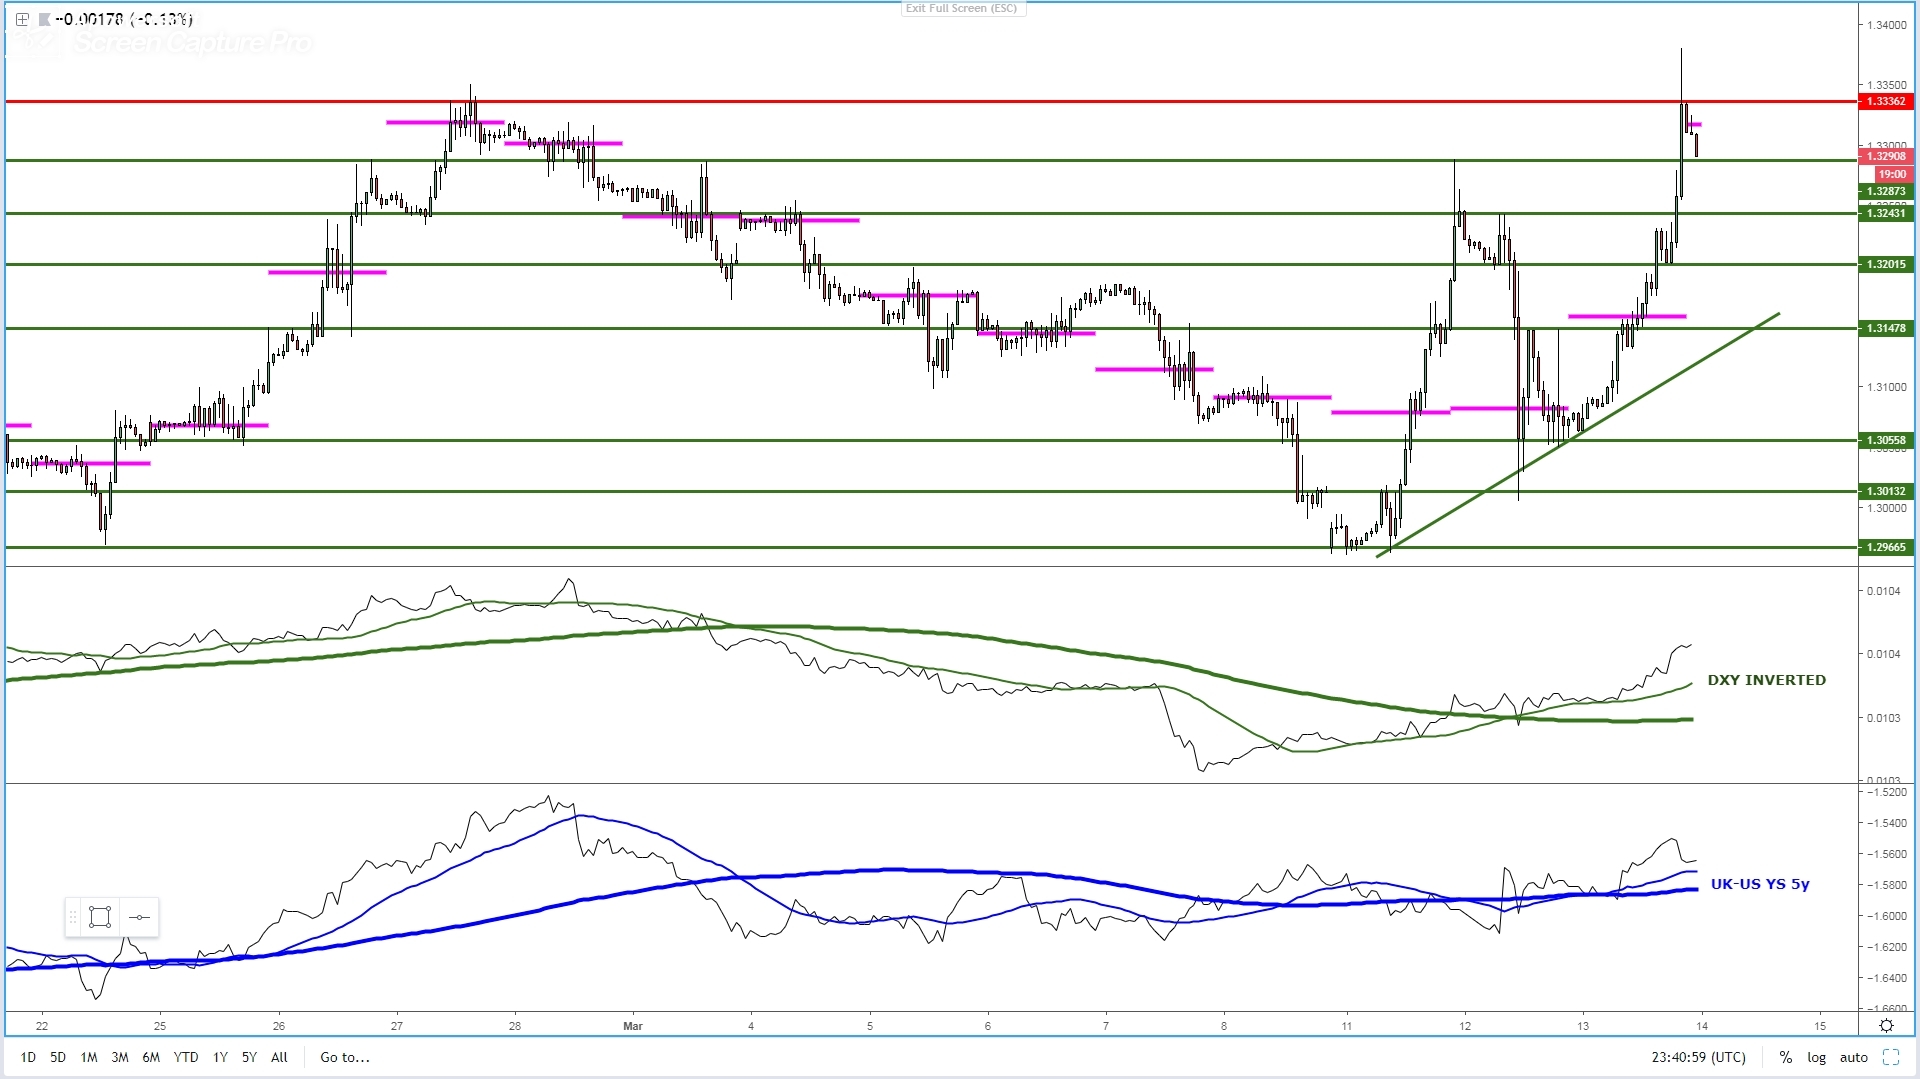
- Straight move up in another blockbuster 300 pips + spike as the market perceives as a GBP positive the vote to reject a “no deal” Brexit scenario.
- The passage of the most recent bills through the UK parliament does not fully eliminate the risk of a so-called “hard Brexit” as the ball is still in the EU’s courtyard to make a final call.
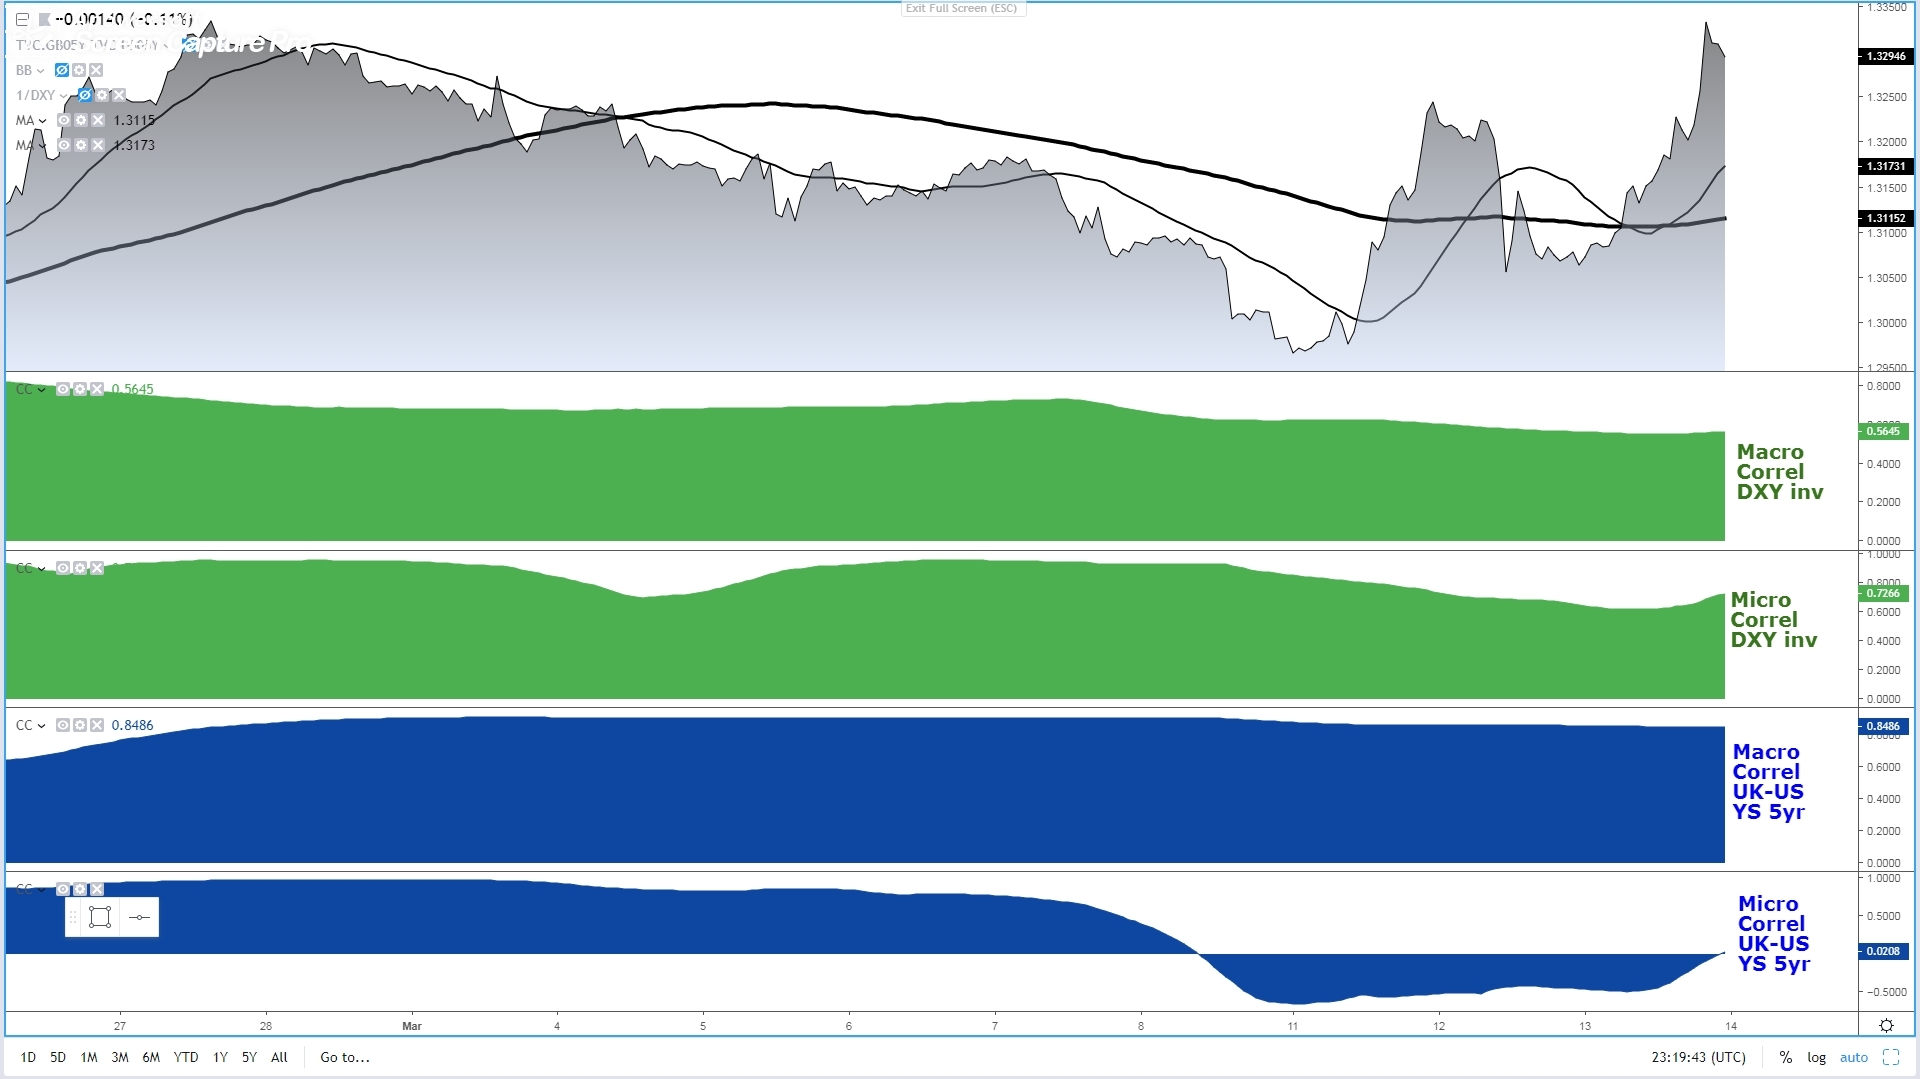
- Technicals are overextended post the late GBP upthrust which has failed to find acceptance above the 1.3350 but still plenty of demand pockets nearby as the green lines indicate.
- If you are trading the pound, it continues to be wise to adjust your normal trade and stop size to accommodate the increasing amount of volatility this week.
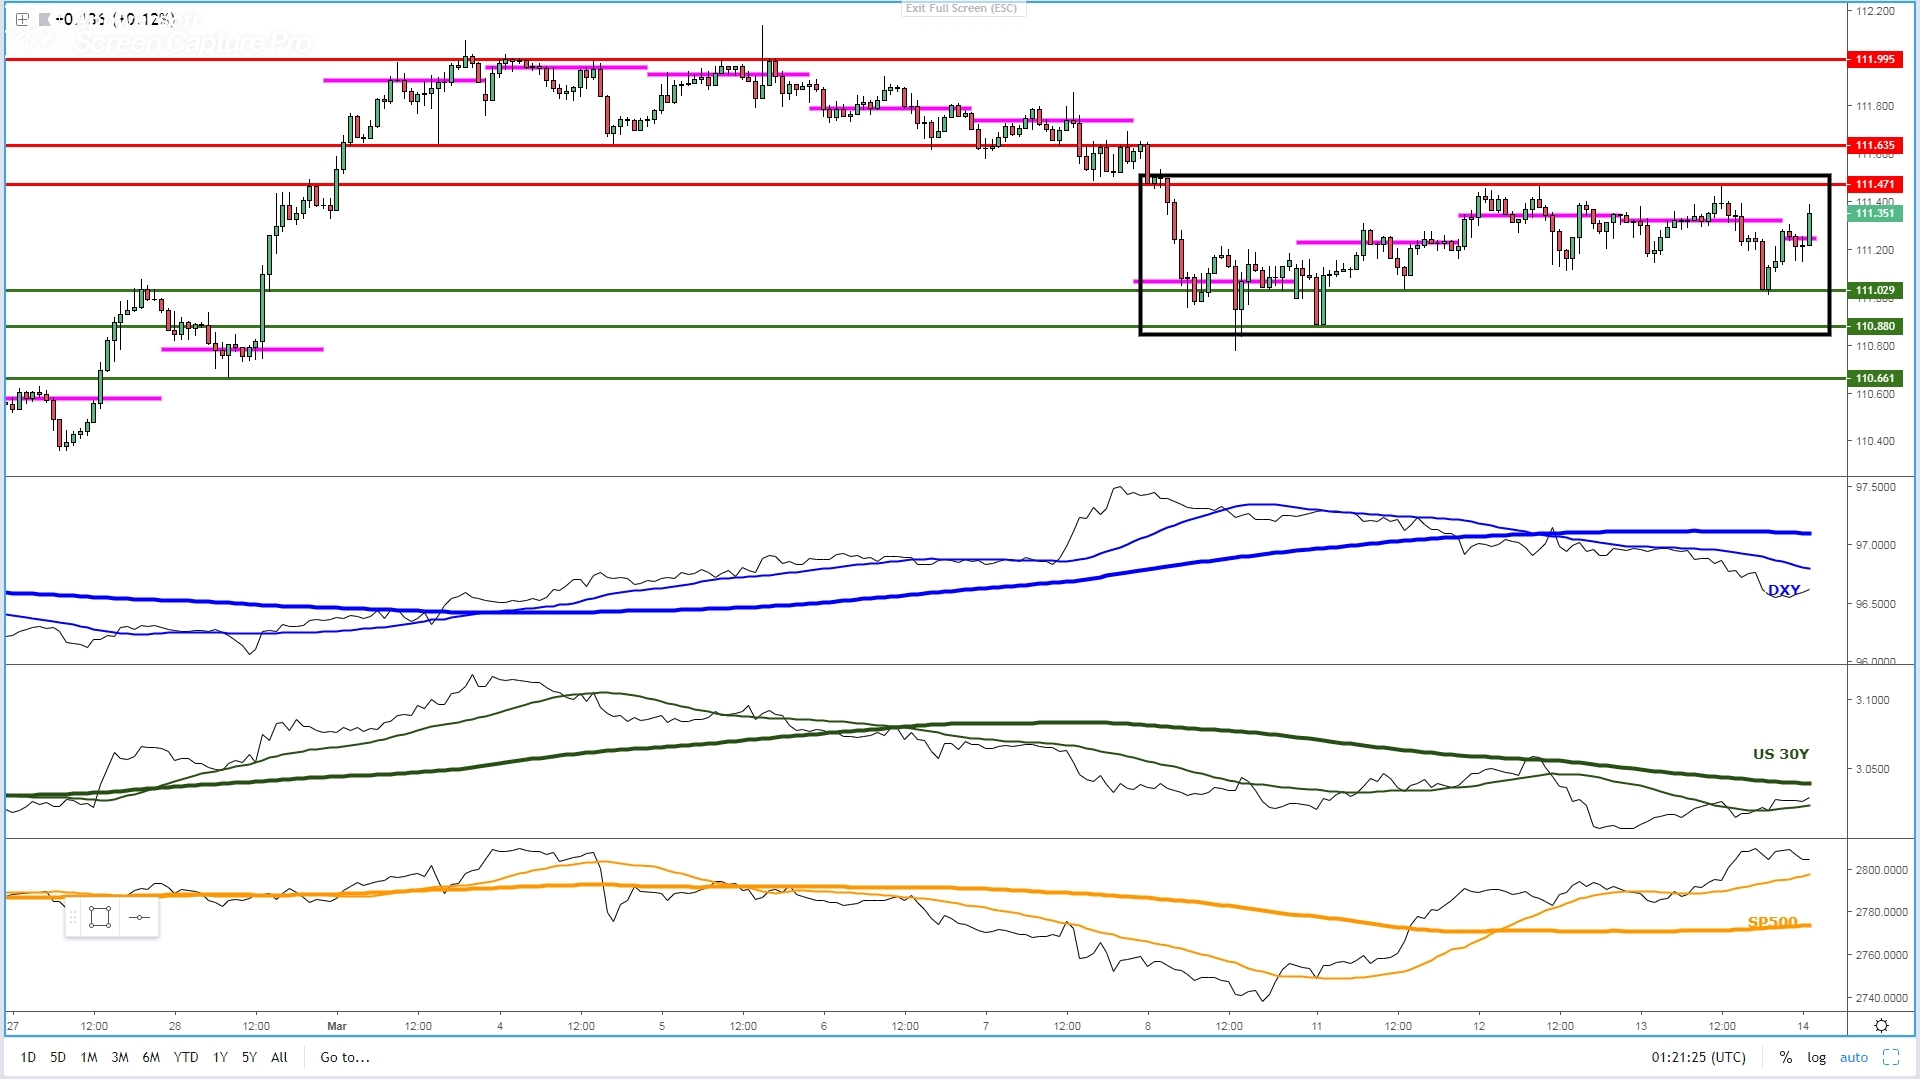
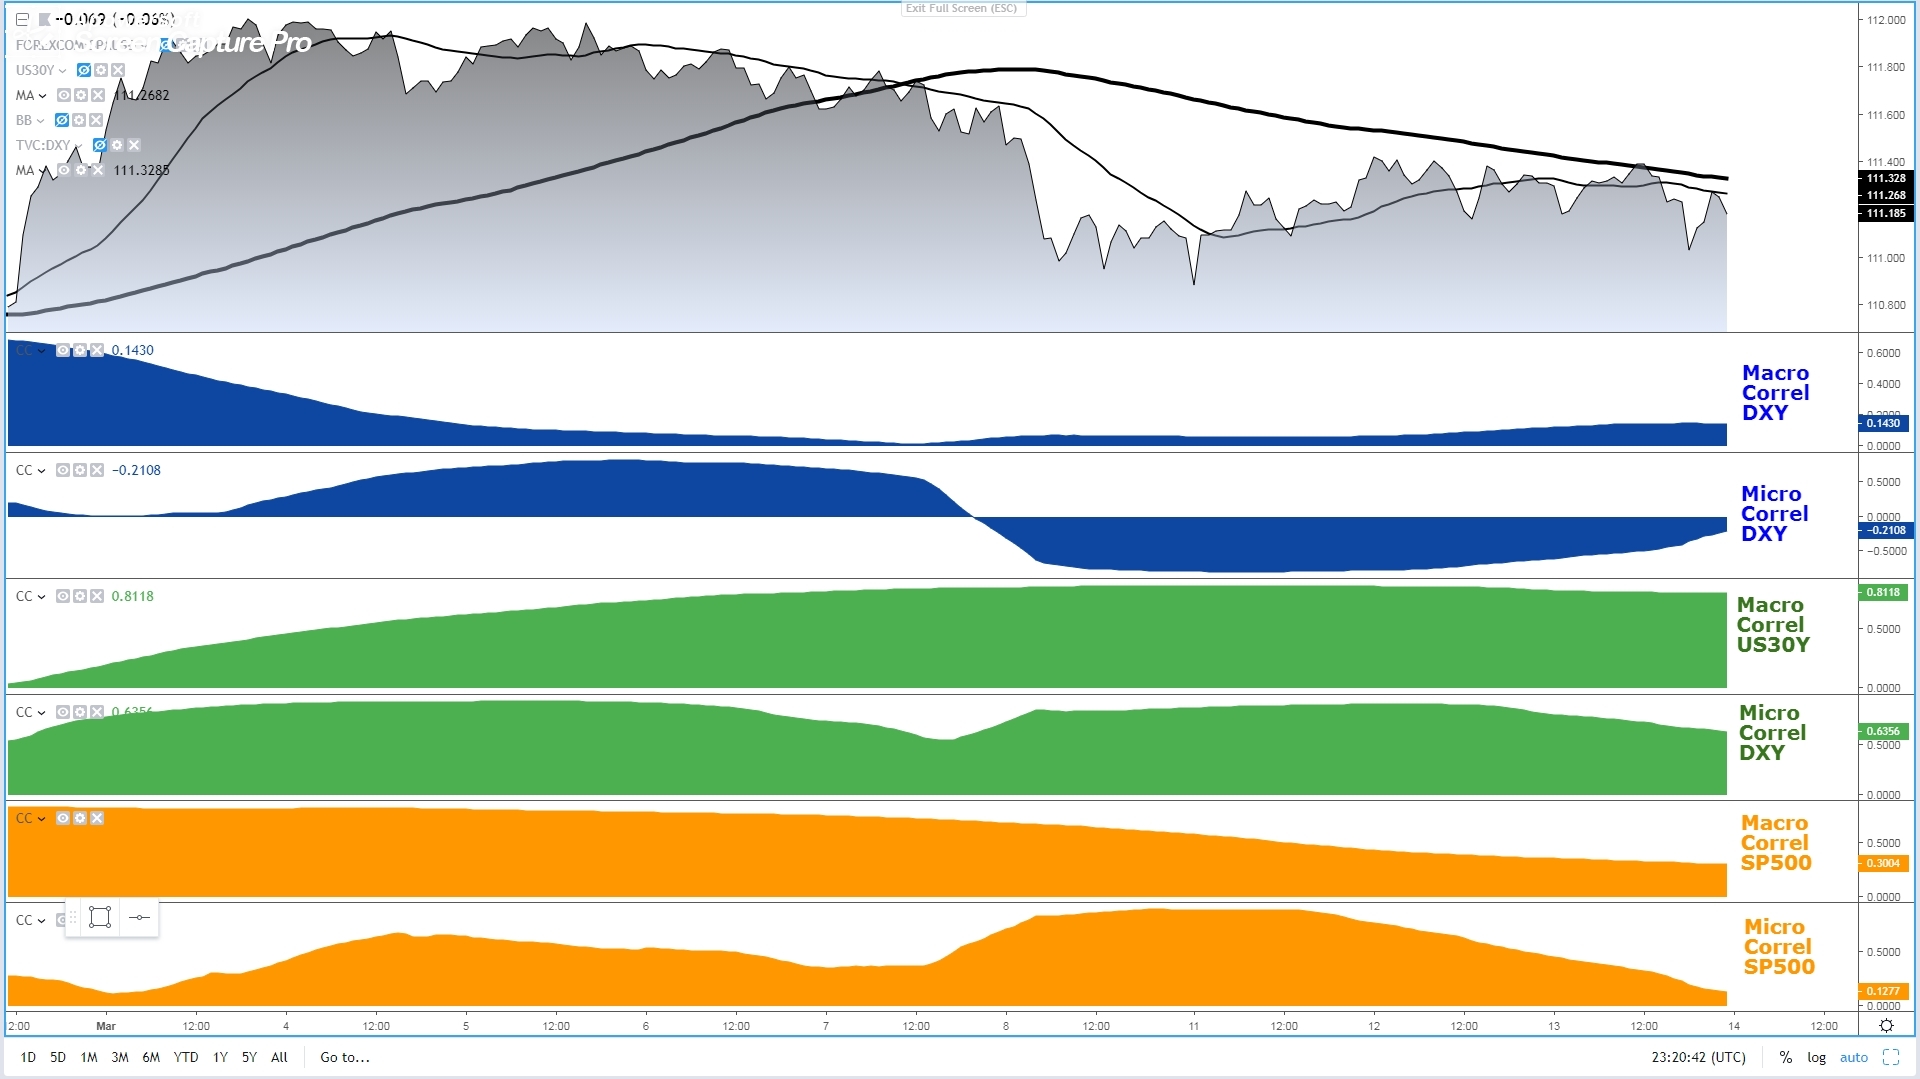
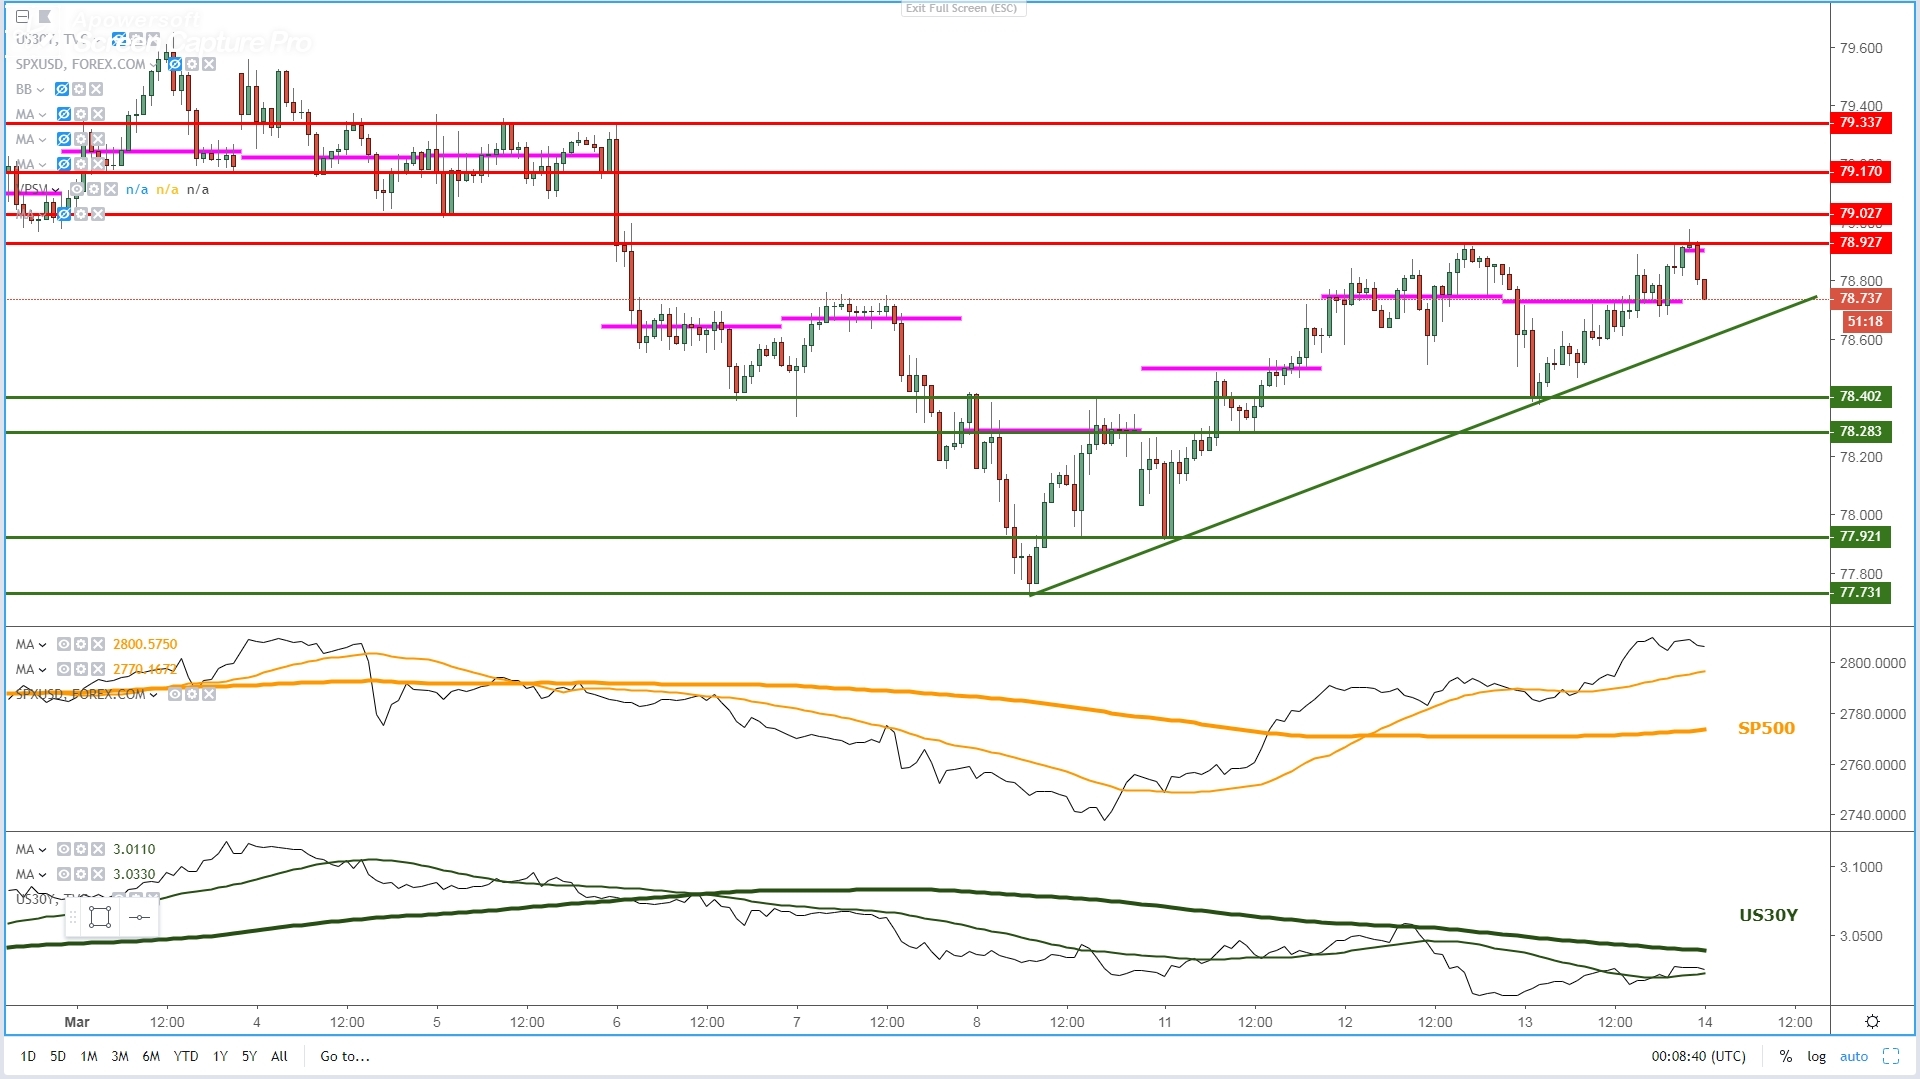
USD/JPY: Trapped In A Range As Interest Elsewhere
- The wax and wane dynamics within a confined 50 pips box remain the norm as none the USD nor the JPY experience enough imbalances as both sold hard on the risk appetite tone.
- The positive trend in equities acts as a source of demand, but this continues to be counterbalanced by the negative tendencies in the DXY and US yields, hence the range.
- The majority of technical measures are still negative, while the intermarket flows have turned slightly more constructive as US yields recover as part of the ‘true risk on’ microflows.
- Amid the lack of clear catalysts, other than a Brexit shocker with broad-based ripple effects, it looks like engaging in buy/sell side activity at the edges for rotations is a sensible strategy.
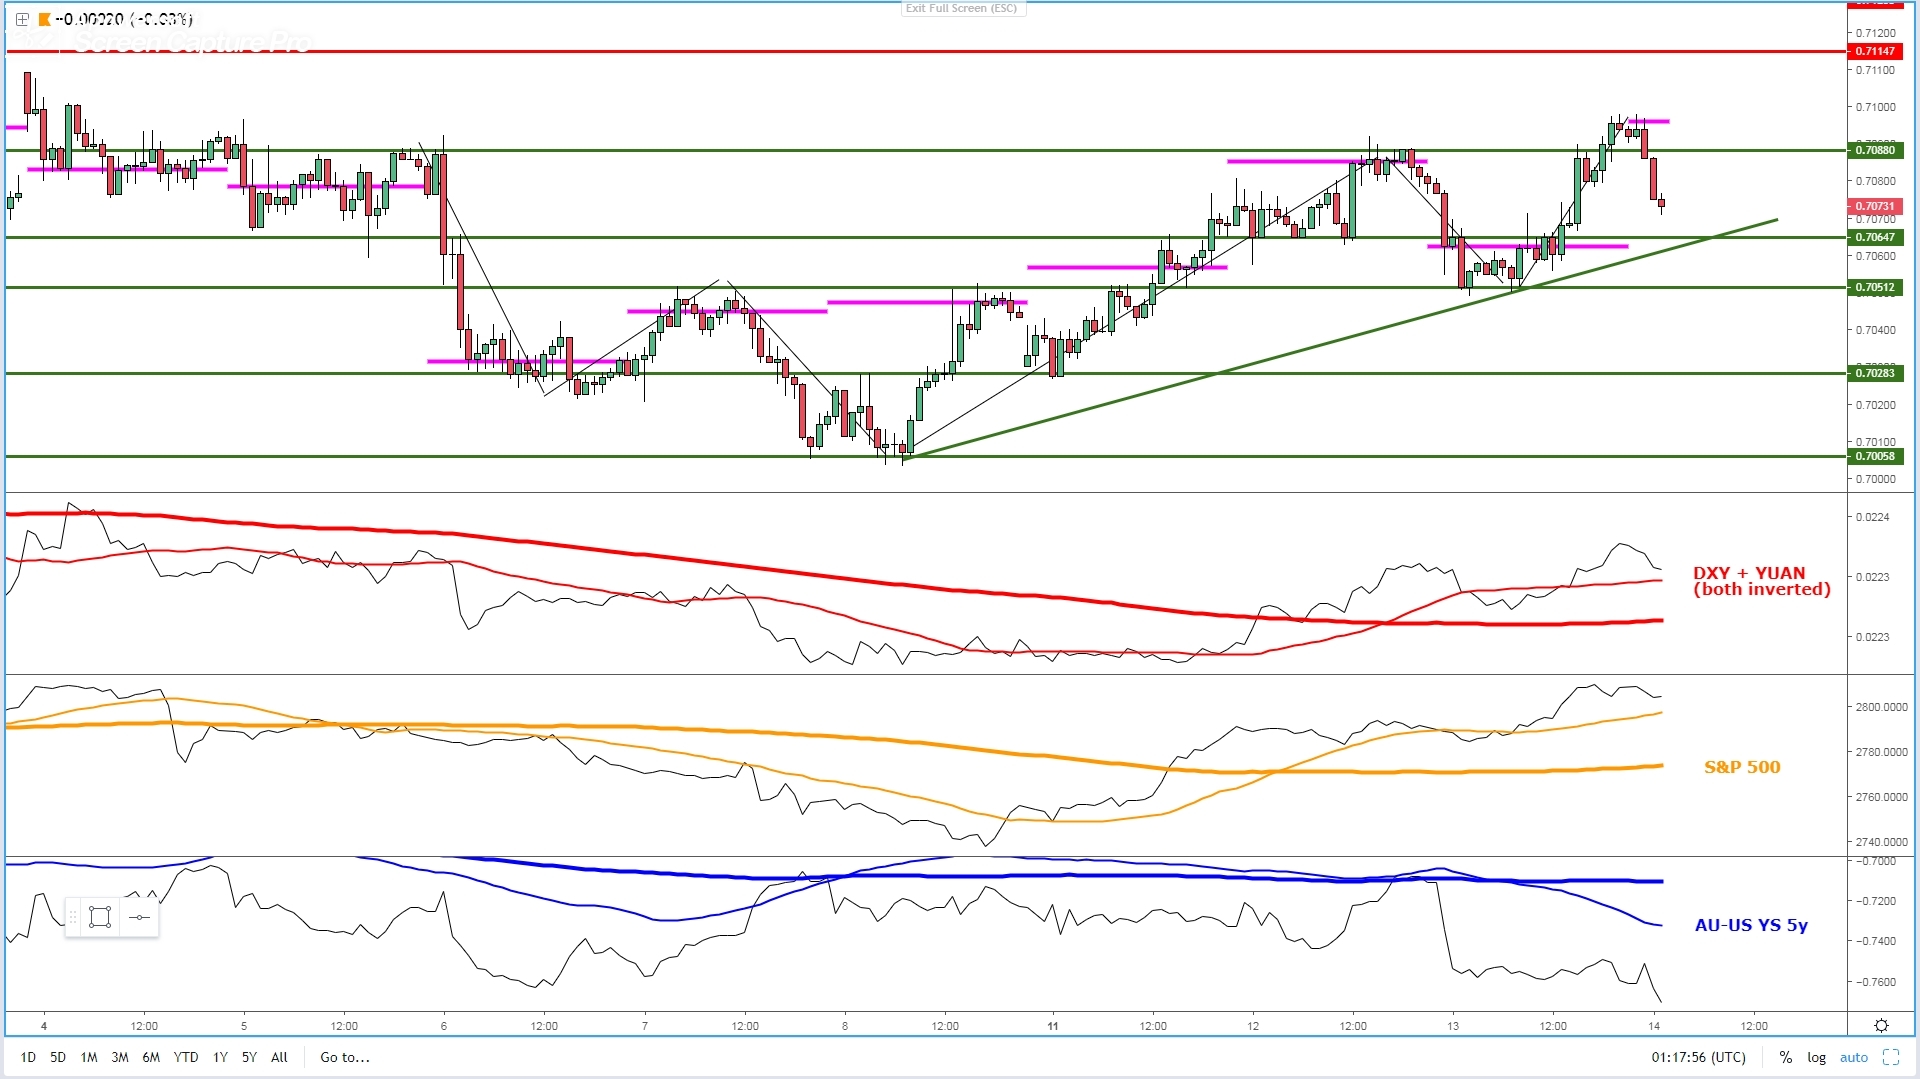
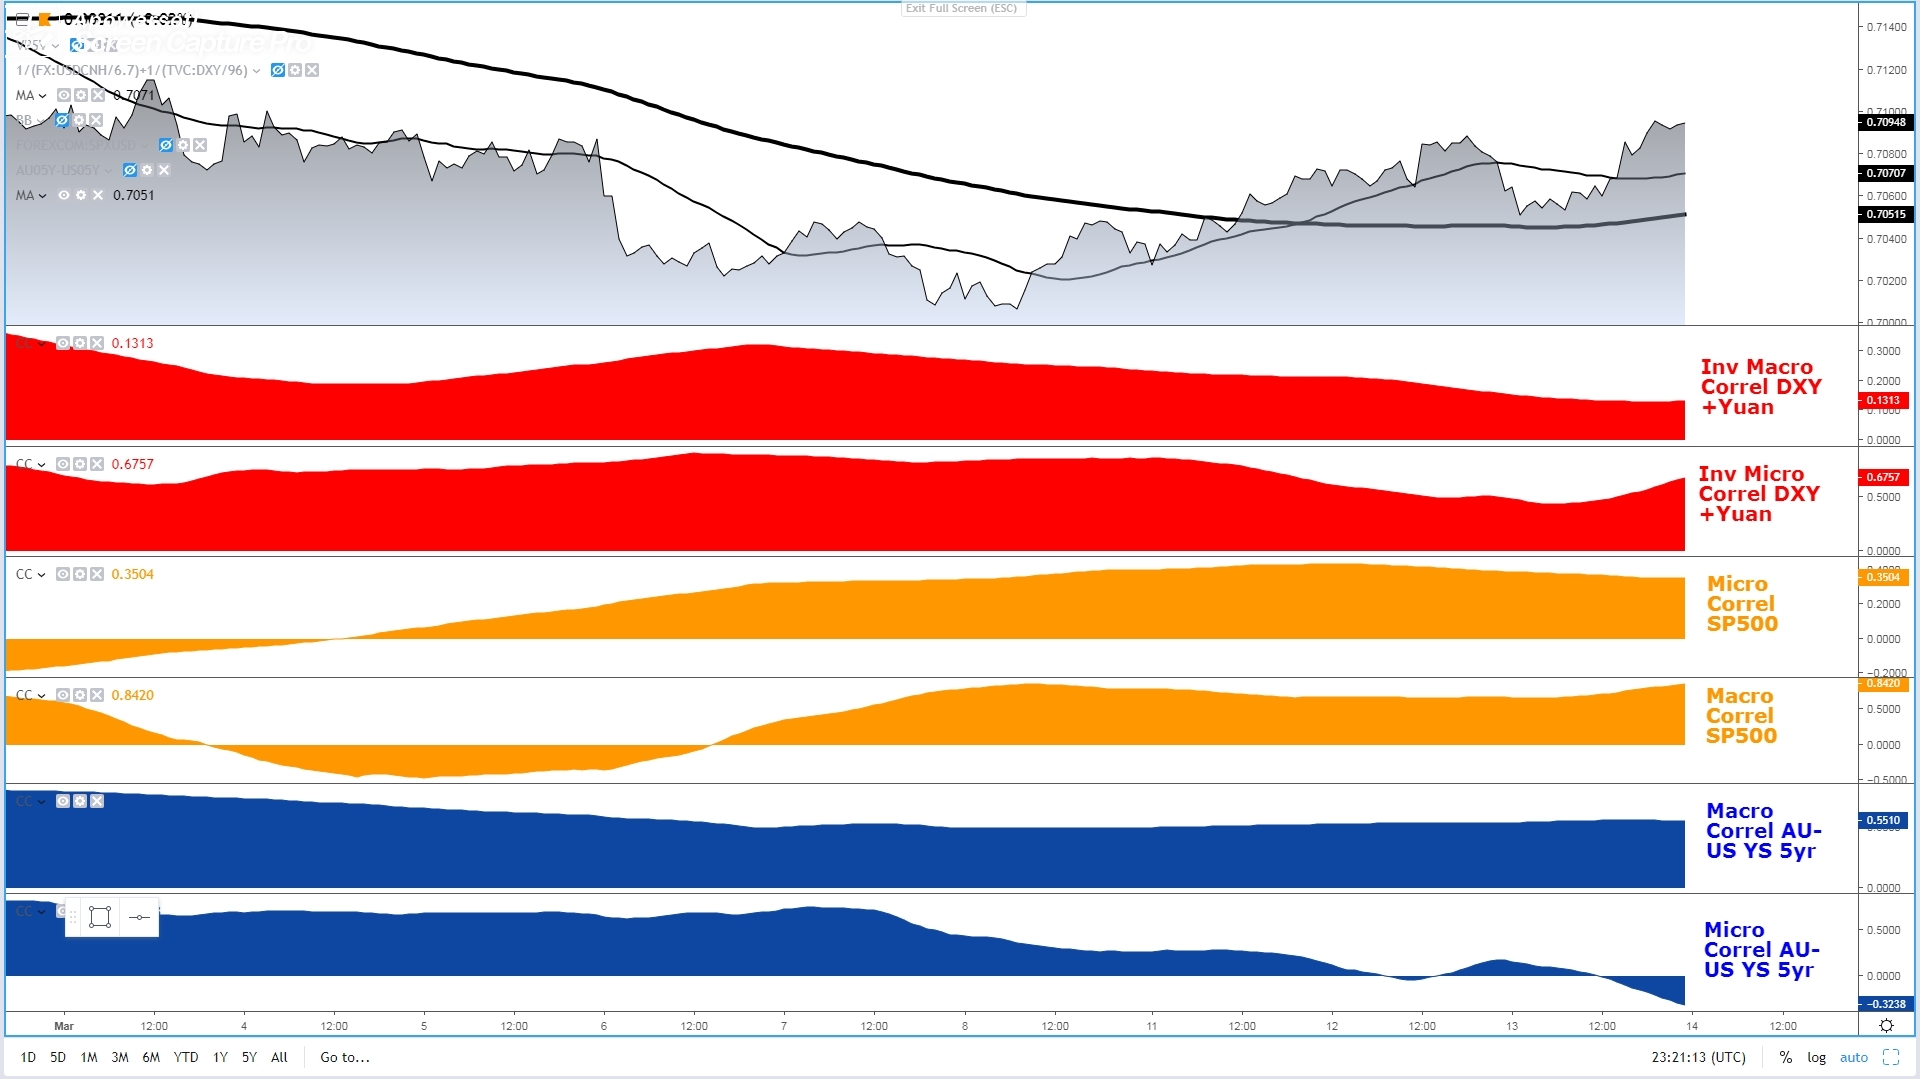
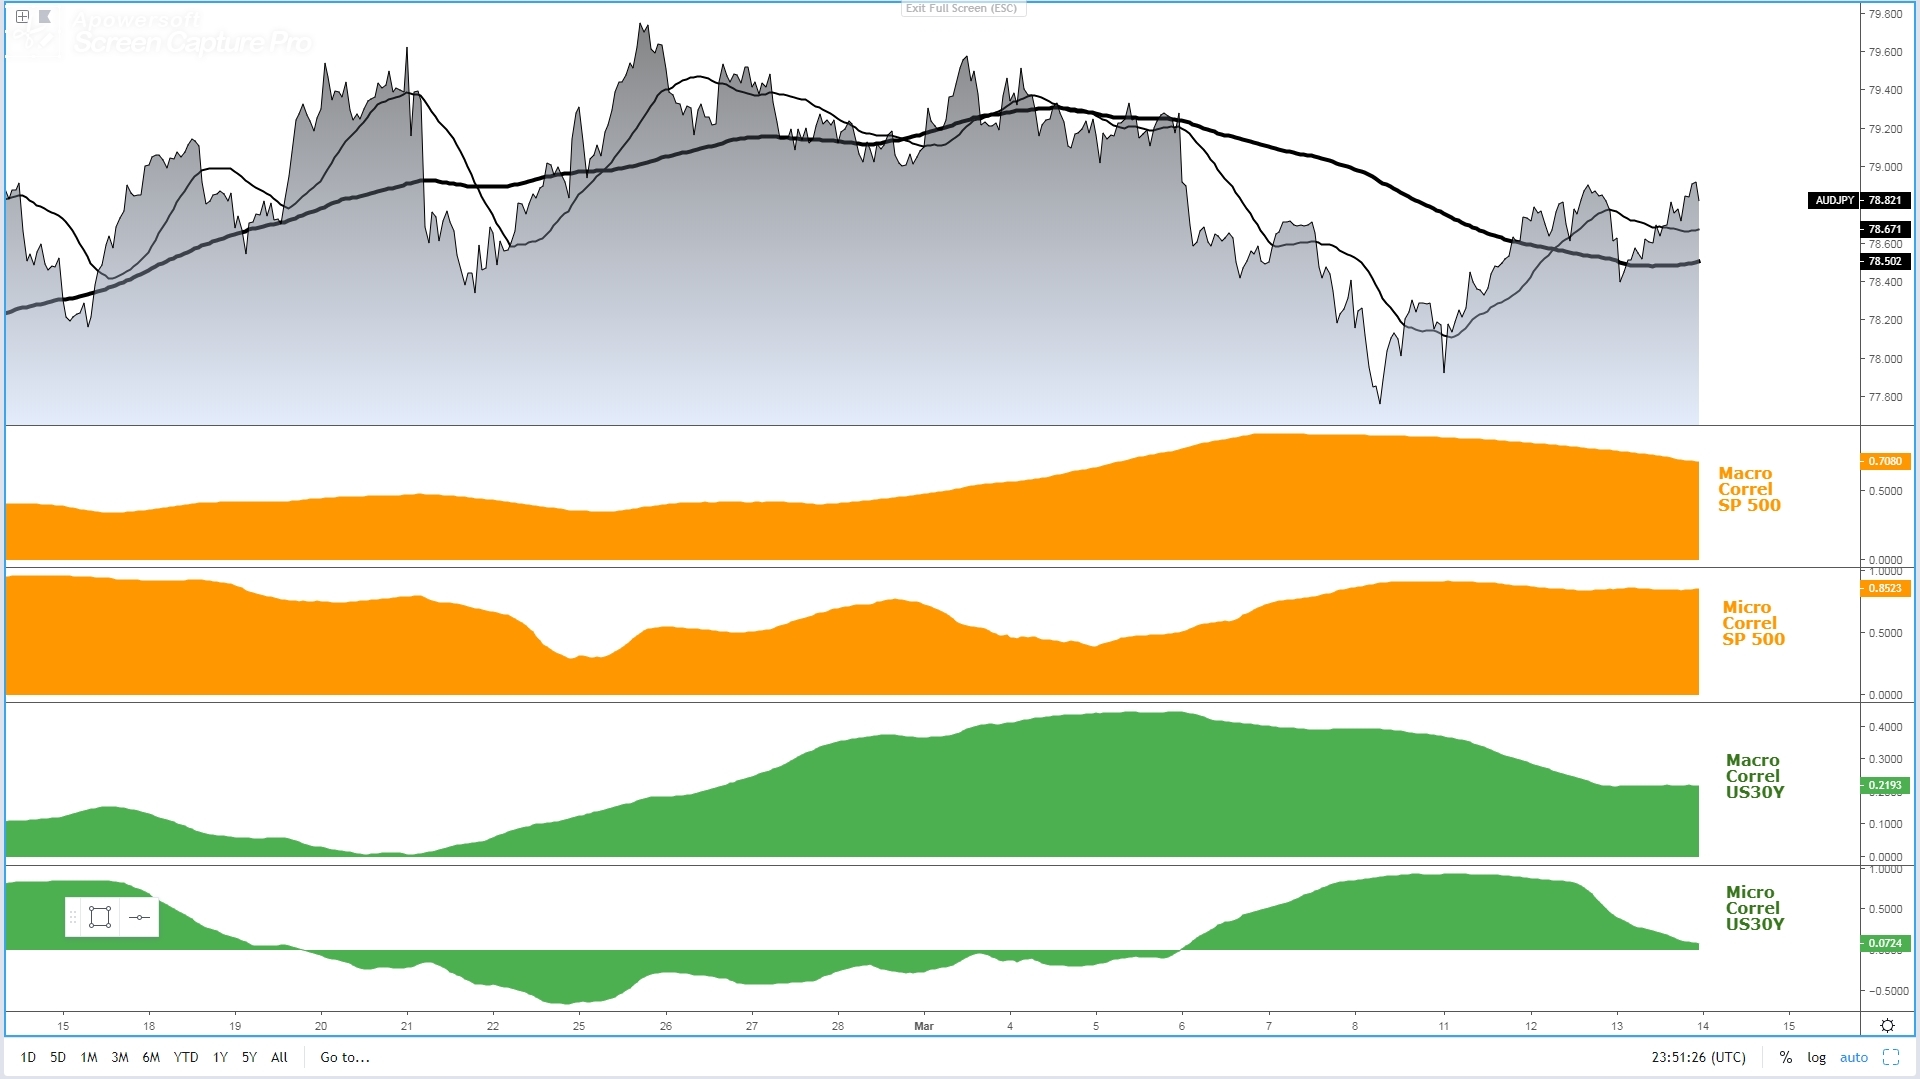
AUD/USD: ‘Risk On’ Outweighs Aus Bond Yield Debacle
- The ‘true risk on’ flows has led to a resurgence of the interest to hold Aussie longs in a move that may appear counterintuitive based on the AU-US bond yield spread fall but…
- ...It makes perfect sense as the ‘true risk on’ flows lead to a lower DXY, higher yuan, spike in equities, which results in AUD positive flows absorbing diminished appeal towards AU yields.
- The latest swing has created a higher high structure which seems to be falling way short in magnitude compared to the previous buy-side flows originating from March 8th low.
- With the Aus-US bond yield spread so depressed, any hiccup in the ‘risk on’ environment that leads to a DXY recovery exposes a fragile Aussie to significant supply imbalances.
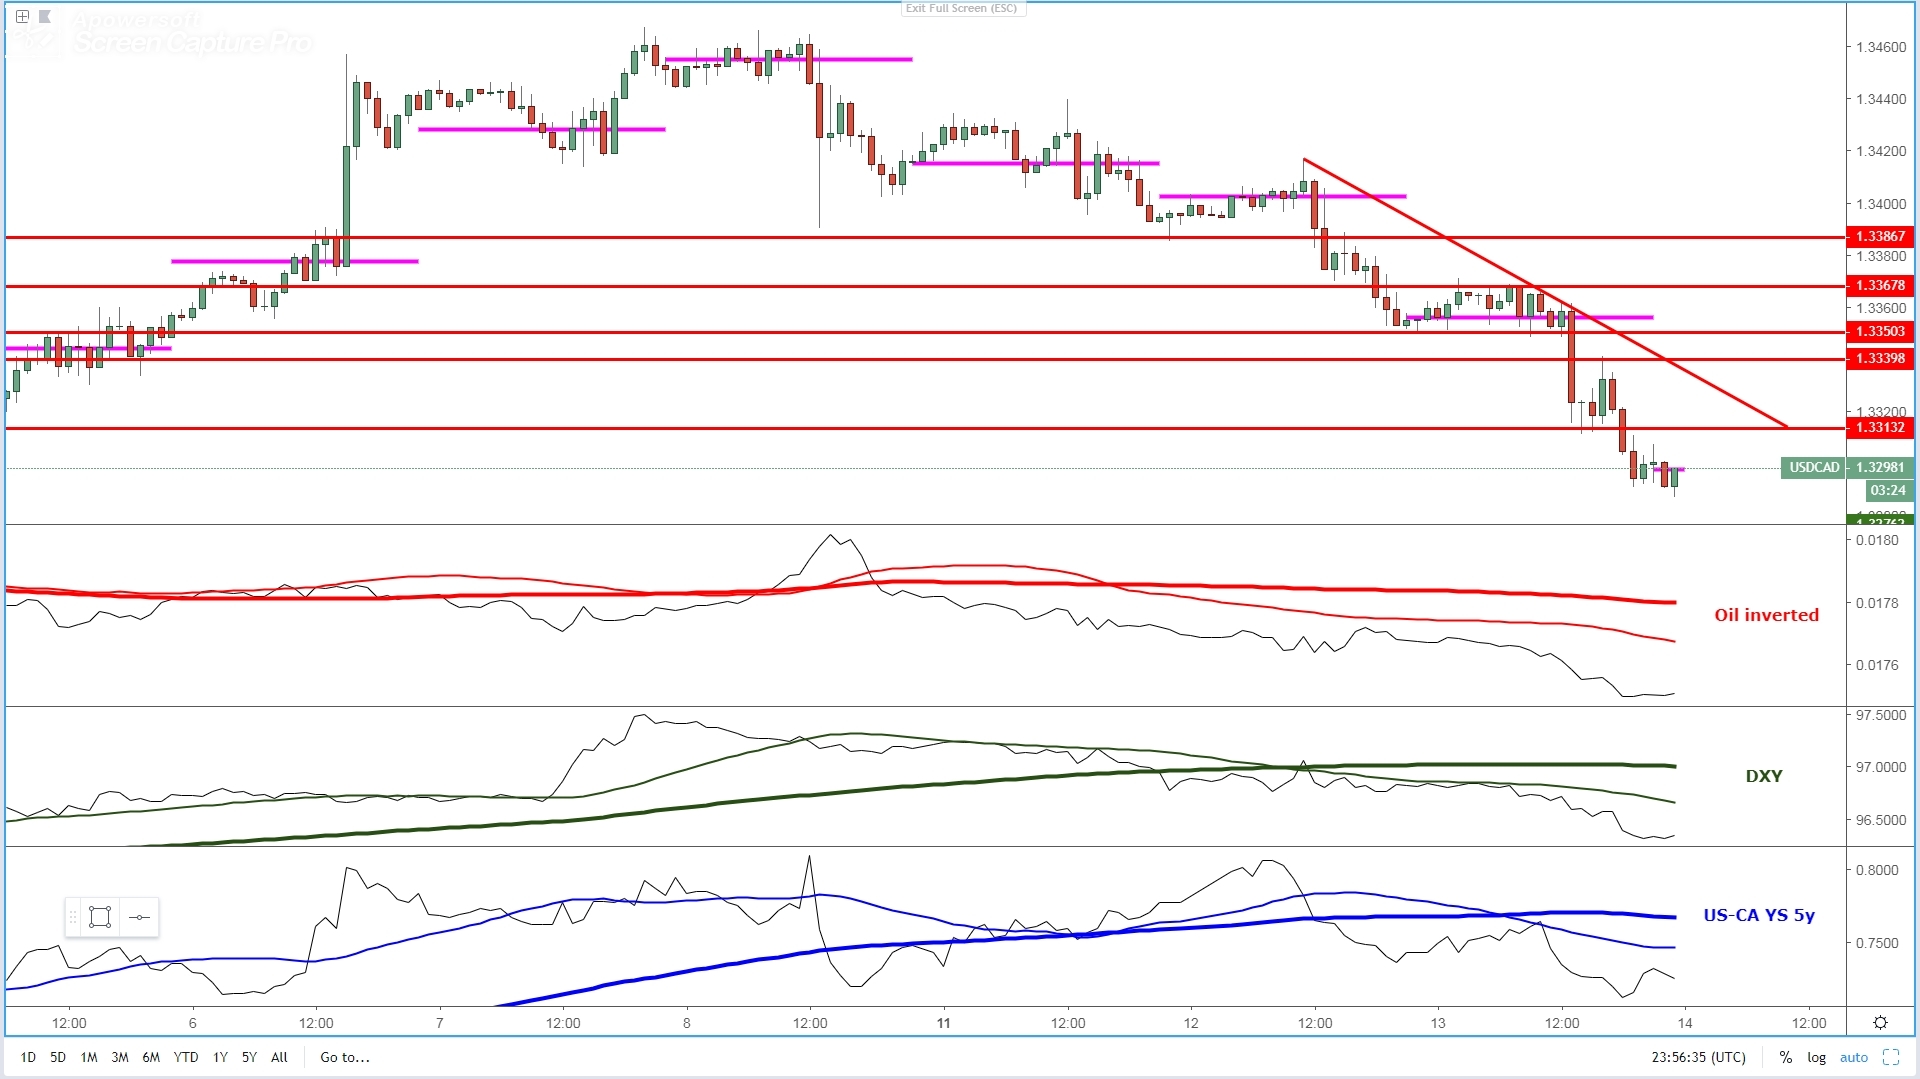
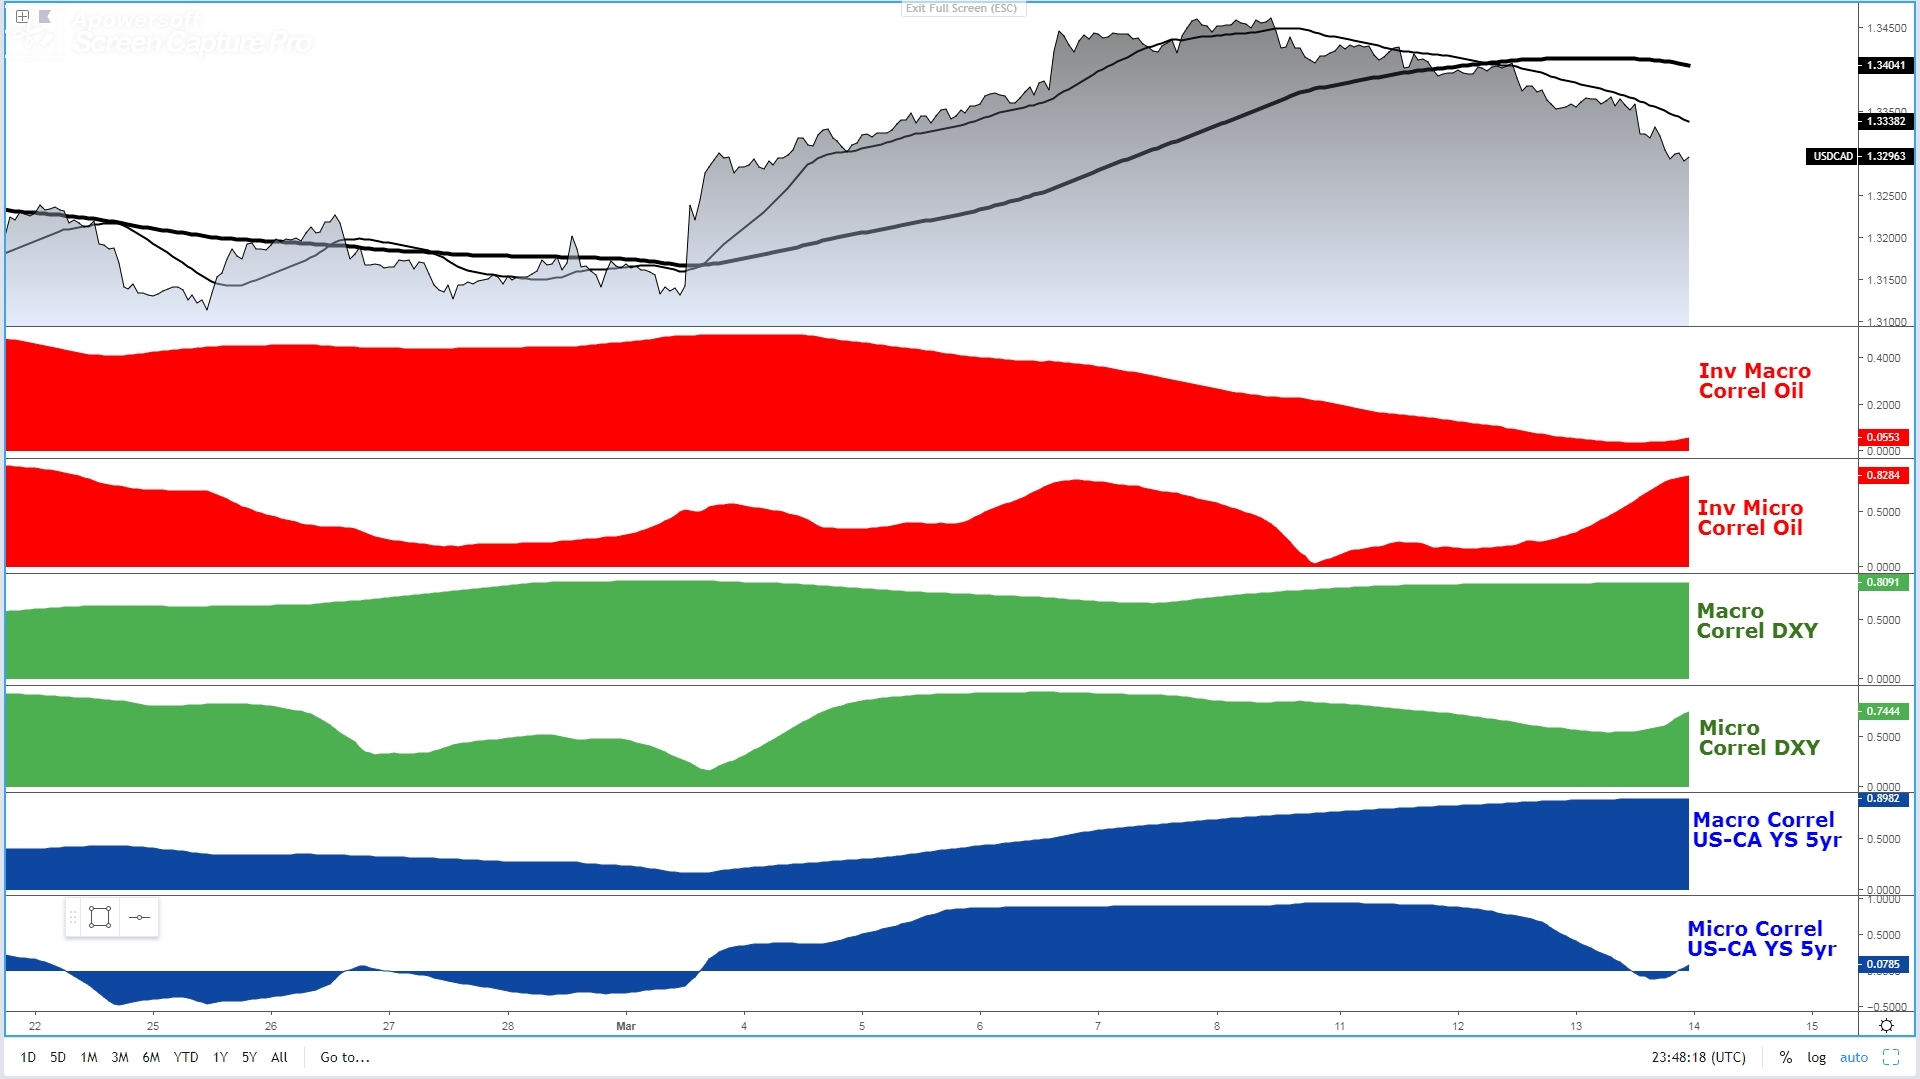
USD/CAD: Perfect Bearish Storm Sinks The Rate
- An even more pronounced downward angle can be observed by connecting the latest two peaks, a testament of the strong sell-side activity in the exchange rate.
- The combination of ‘true risk on’ coupled with strong gains in the Oil prices has encouraged sell-side flows, while rumors of tariff removal by the US to Canada also assists.
- Unless scalping the market, I see limited risk-reward to play this market short until at least a correction towards the 3rd touch of the most recent trendline at play.
- As usual, wait for the price to come up to decision areas to then assess the market conditions and whether or not there is an edge to be found via intermarket analysis.
- As intermarket studies stand, this market has written all over the wall to still sell on strength judging by the alignment of micro/macro slopes in Oil, DXY, yield spreads.
Additional Charts
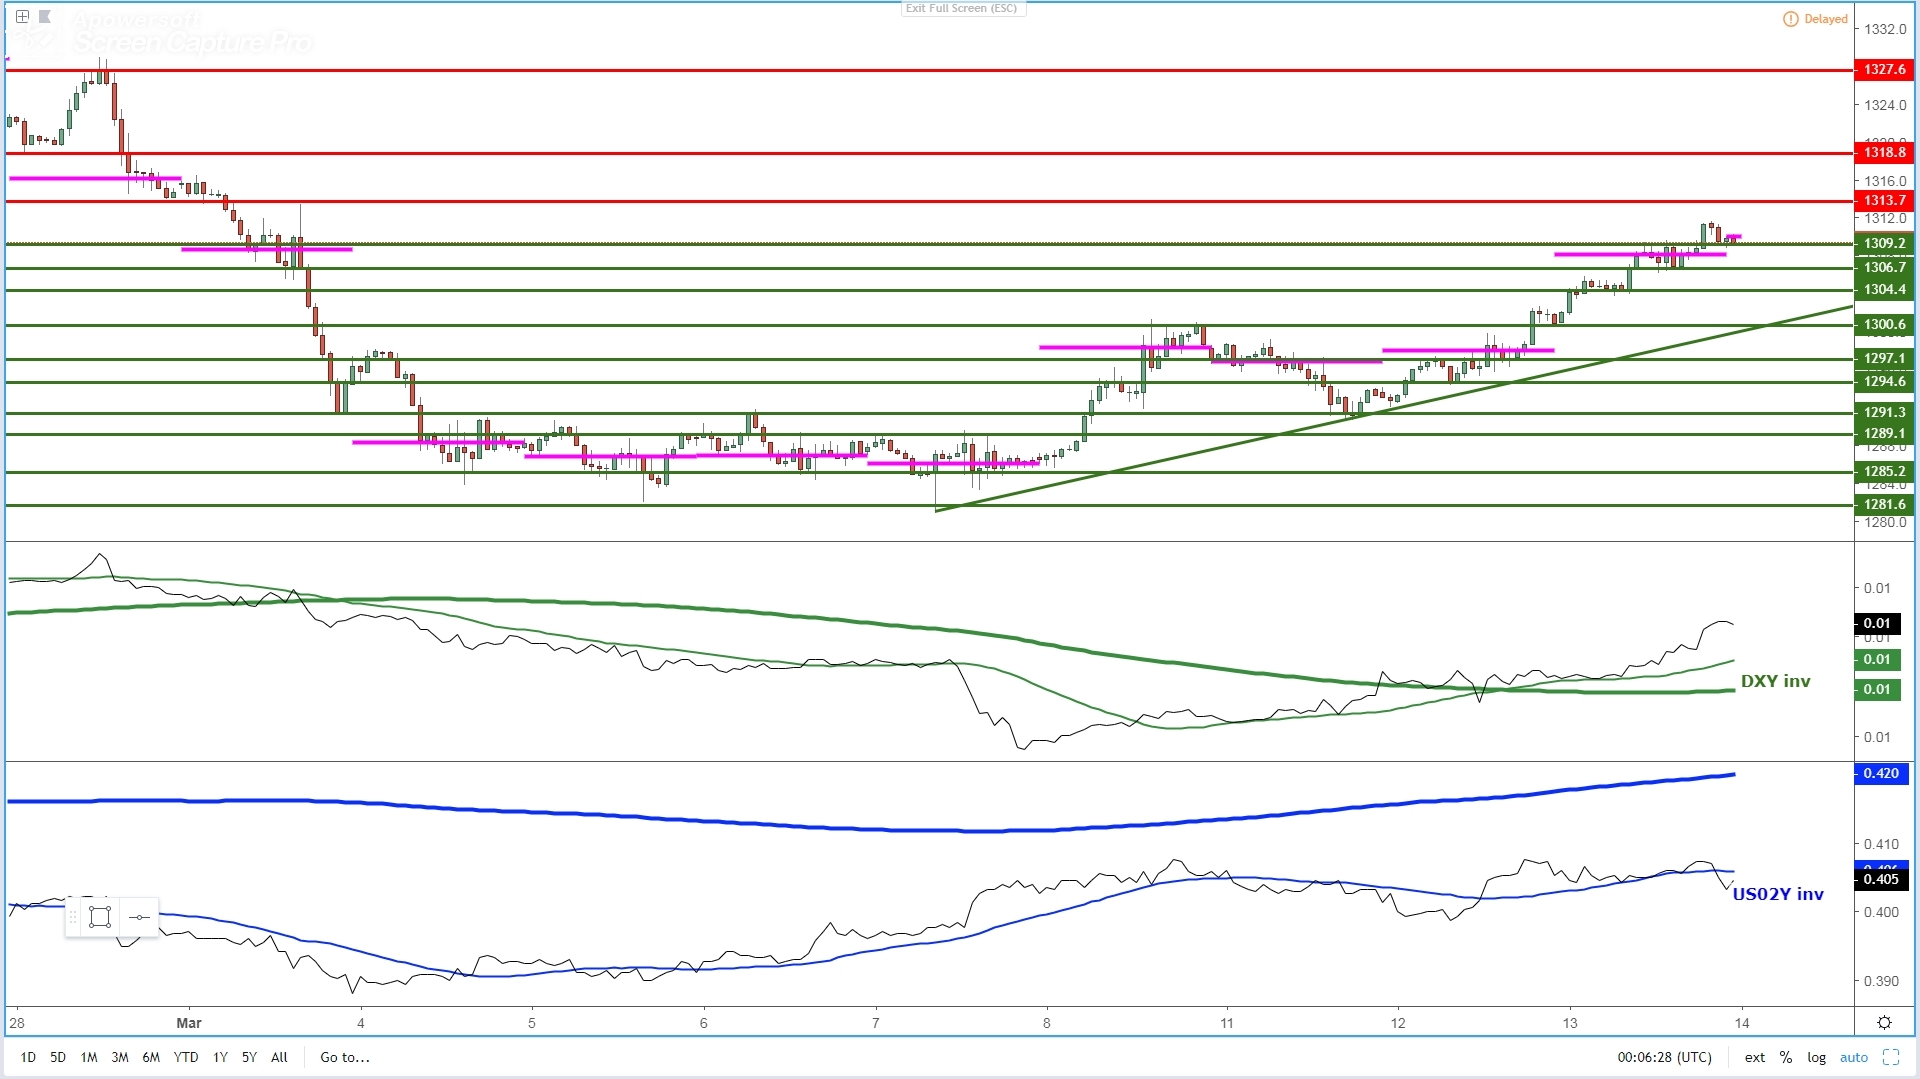
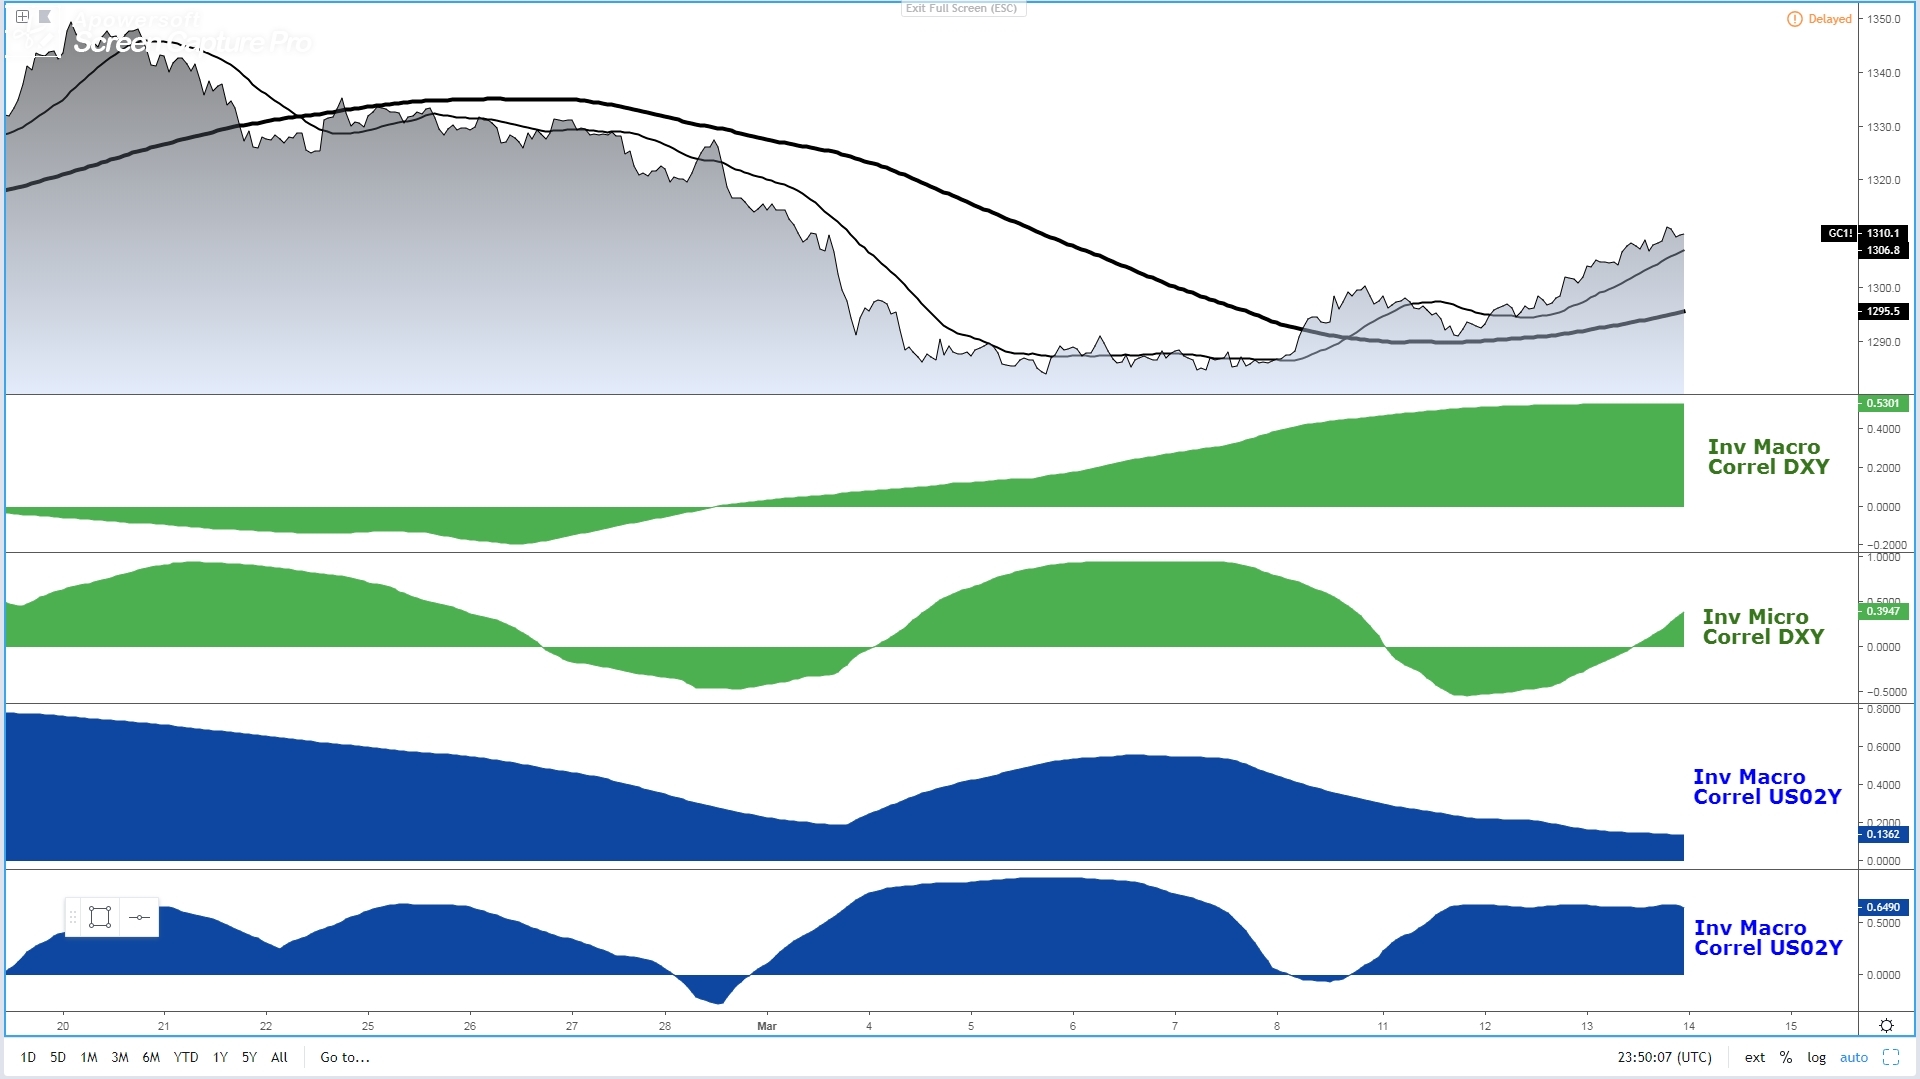
Gold Resumes Its Bullish Trend As Intermarket Flows Align
AUD/JPY: Finds Decent Demand As 'True Risk On' Re-Ignited
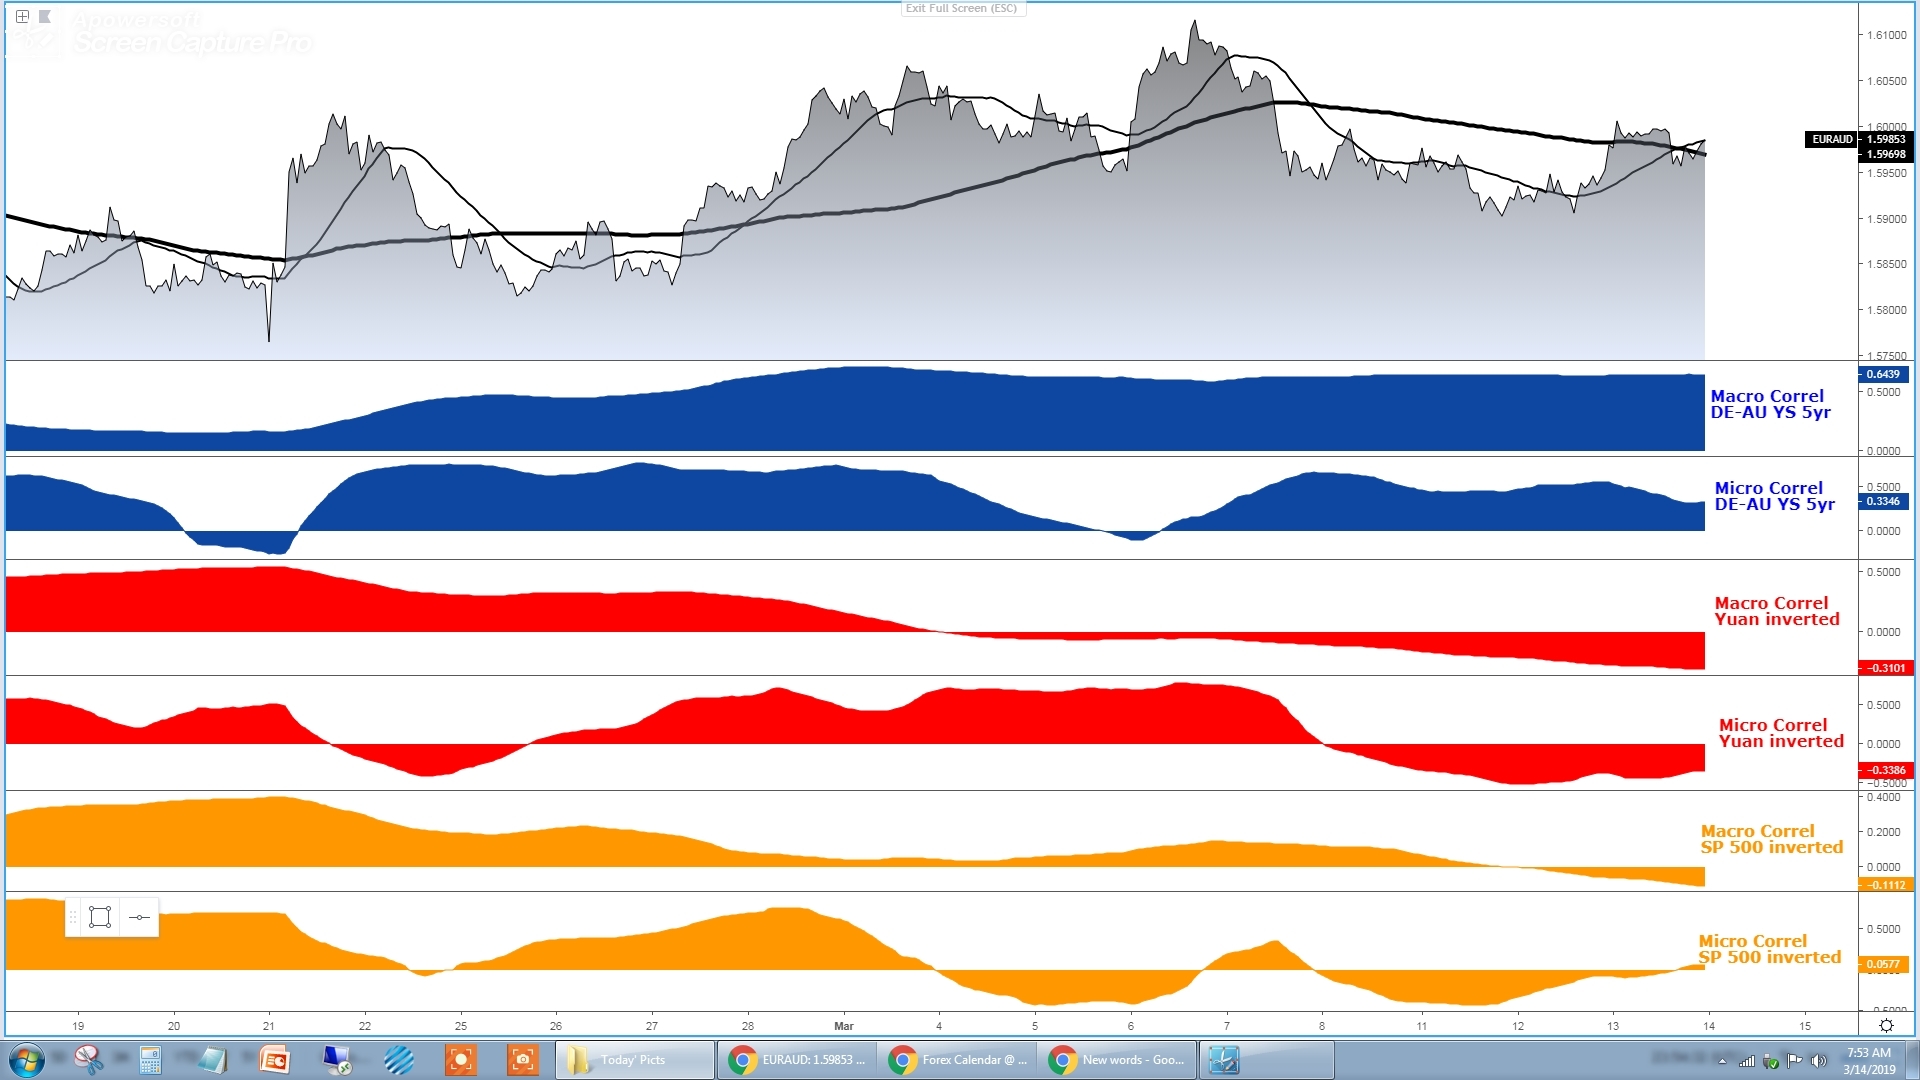
EUR/AUD: Recovery In German vs Aus Yield Spread Leads The Way
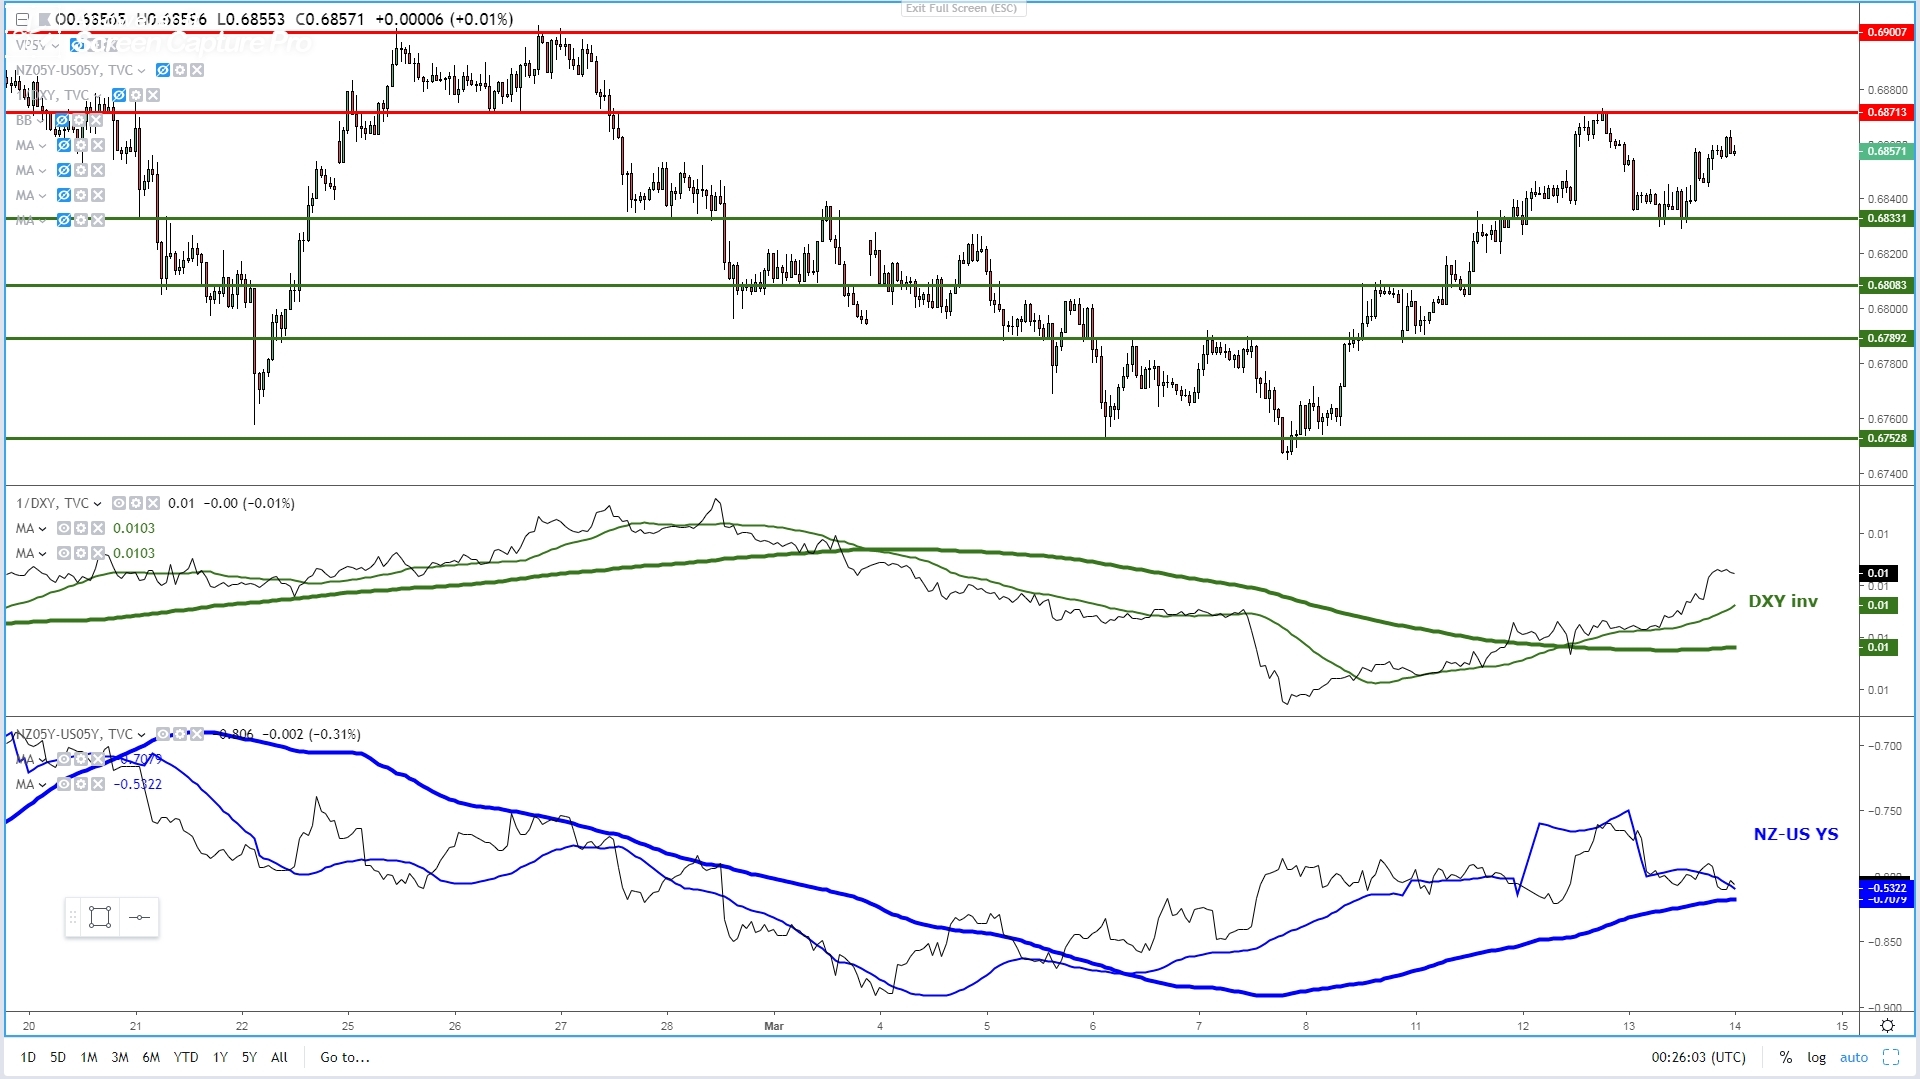
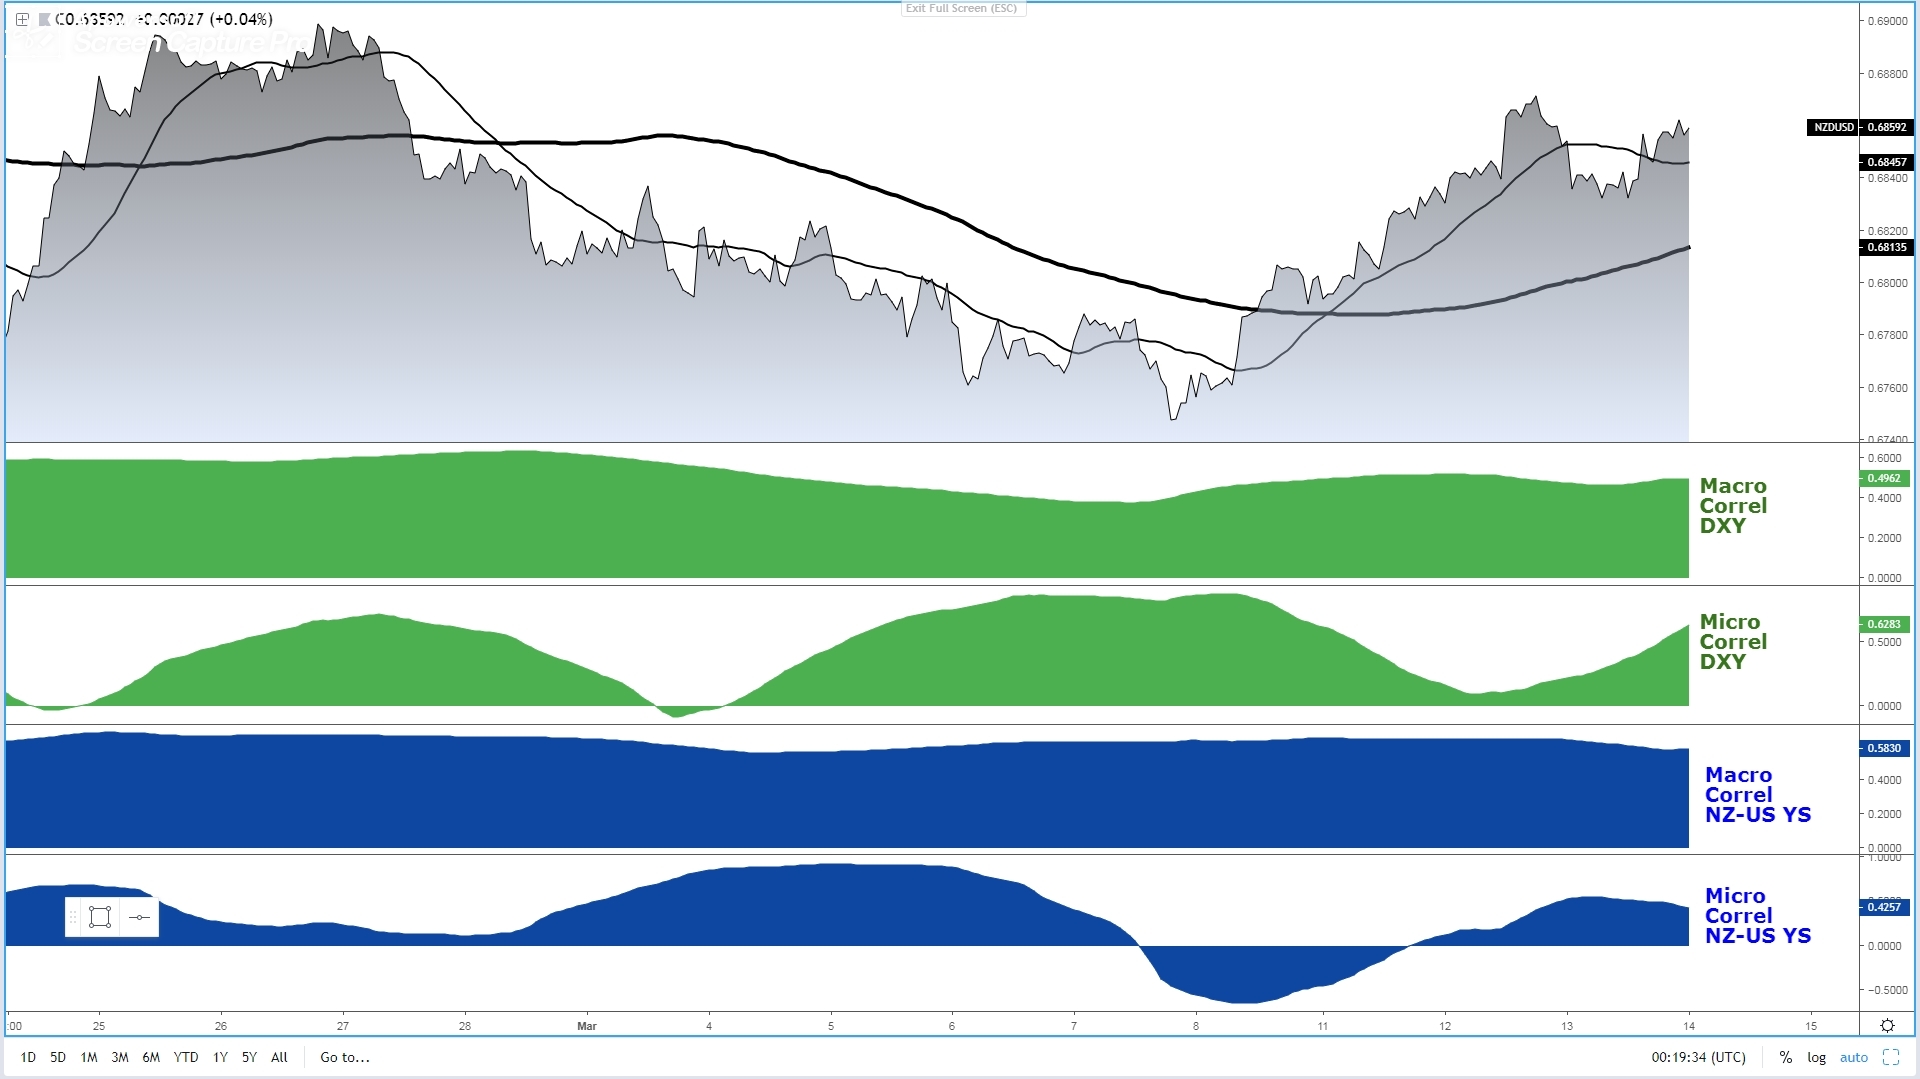
NZD/USD: Uptrend In Place, Setback Finds Buyers
IMPORTANT FOOTNOTES
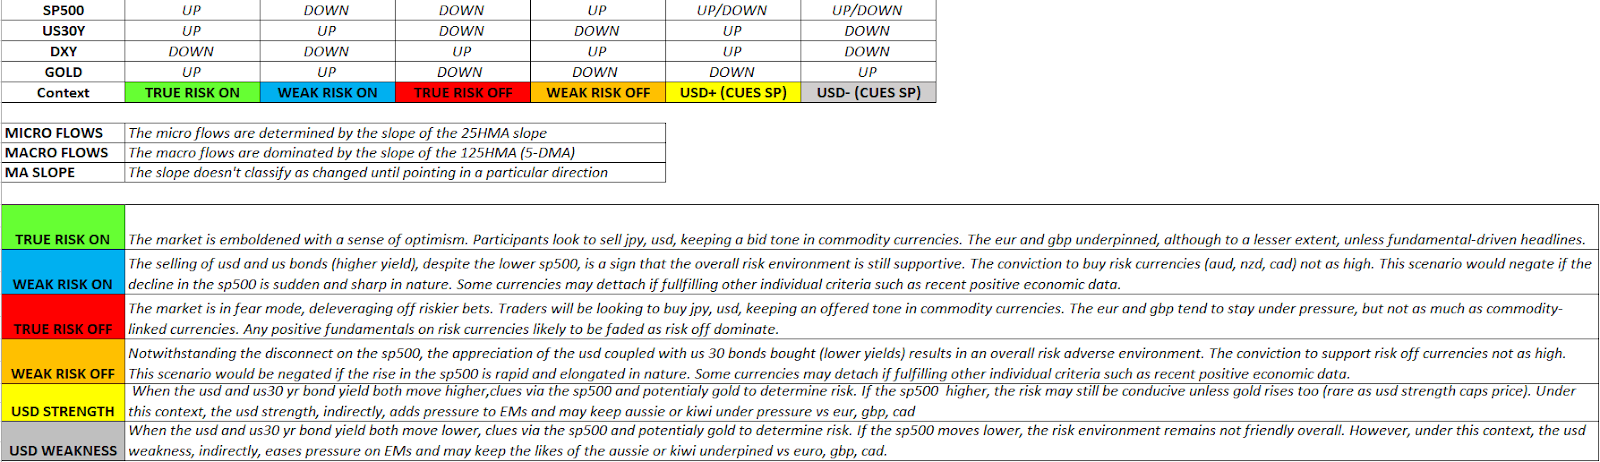
- Risk model: The fact that financial markets have become so intertwined and dynamic makes it essential to stay constantly in tune with market conditions and adapt to new environments. This prop model will assist you to gauge the context that you are trading so that you can significantly reduce the downside risks. To understand the principles applied in the assessment of this model, refer to the tutorial How to Unpack Risk Sentiment Profiles
- Cycles: Markets evolve in cycles followed by a period of distribution and/or accumulation. The weekly cycles are highlighted in red, blue refers to the daily, while the black lines represent the hourly cycles. To understand the principles applied in the assessment of cycles, refer to the tutorial How To Read Market Structures In Forex
- POC: It refers to the point of control. It represents the areas of most interest by trading volume and should act as walls of bids/offers that may result in price reversals. The volume profile analysis tracks trading activity over a specified time period at specified price levels. The study reveals the constant evolution of the market auction process. If you wish to find out more about the importance of the POC, refer to the tutorial How to Read Volume Profile Structures
- Tick Volume: Price updates activity provides great insights into the actual buy or sell-side commitment to be engaged into a specific directional movement. Studies validate that price updates (tick volume) are highly correlated to actual traded volume, with the correlation being very high, when looking at hourly data. If you wish to find out more about the importance tick volume, refer to the tutorial on Why Is Tick Volume Important To Monitor?
- Horizontal Support/Resistance: Unlike levels of dynamic support or resistance or more subjective measurements such as fibonacci retracements, pivot points, trendlines, or other forms of reactive areas, the horizontal lines of support and resistance are universal concepts used by the majority of market participants. It, therefore, makes the areas the most widely followed and relevant to monitor. The Ultimate Guide To Identify Areas Of High Interest In Any Market
- Trendlines: Besides the horizontal lines, trendlines are helpful as a visual representation of the trend. The trendlines are drawn respecting a series of rules that determine the validation of a new cycle being created. Therefore, these trendline drawn in the chart hinge to a certain interpretation of market structures.
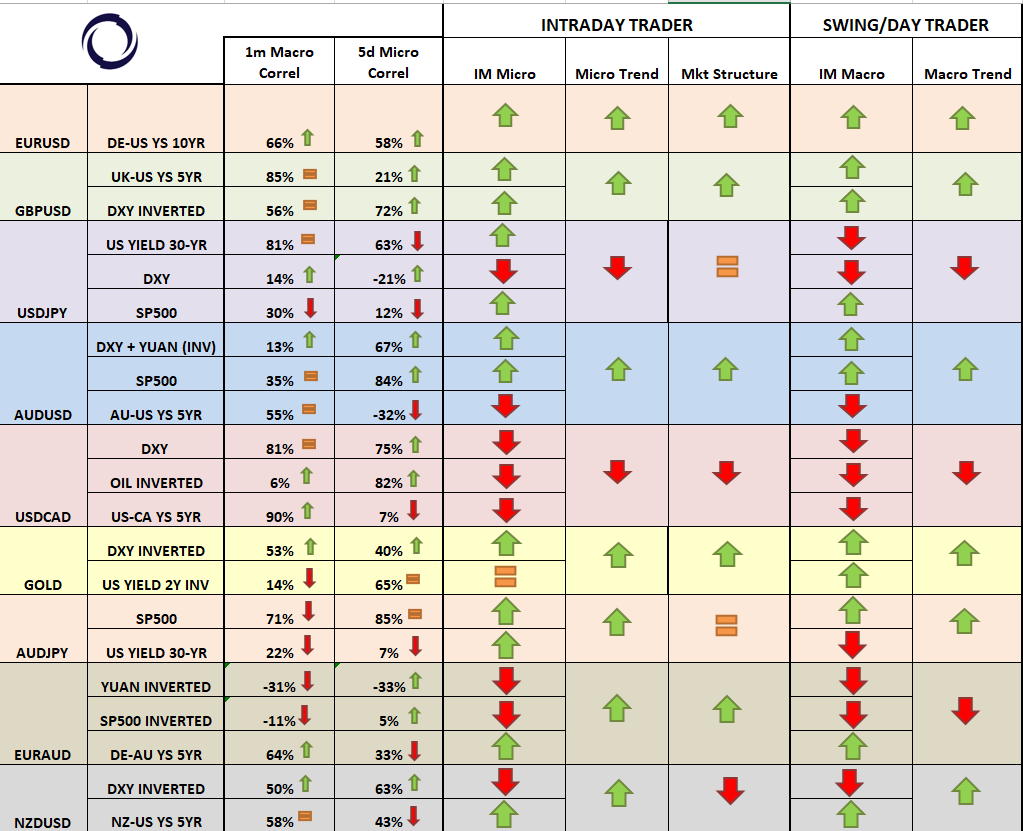
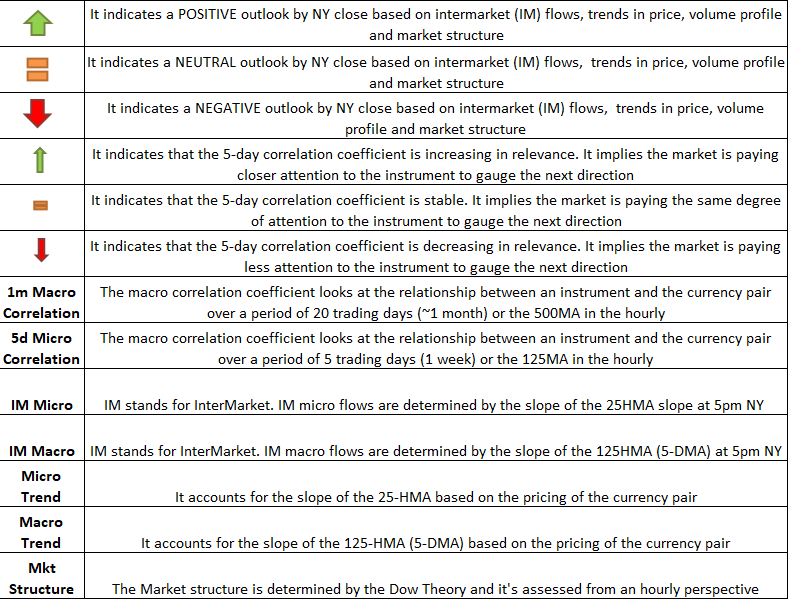
- Correlations: Each forex pair has a series of highly correlated assets to assess valuations. This type of study is called inter-market analysis and it involves scoping out anomalies in the ever-evolving global interconnectivity between equities, bonds, currencies, and commodities. If you would like to understand more about this concept, refer to the tutorial How Divergence In Correlated Assets Can Help You Add An Edge.
- Fundamentals: It’s important to highlight that the daily market outlook provided in this report is subject to the impact of the fundamental news. Any unexpected news may cause the price to behave erratically in the short term.
- Projection Targets: The usefulness of the 100% projection resides in the symmetry and harmonic relationships of market cycles. By drawing a 100% projection, you can anticipate the area in the chart where some type of pause and potential reversals in price is likely to occur, due to 1. The side in control of the cycle takes profits 2. Counter-trend positions are added by contrarian players 3. These are price points where limit orders are set by market-makers. You can find out more by reading the tutorial on The Magical 100% Fibonacci Projection