GBP/USD: Sterling falls ahead of BoE decision
Macroeconomic overview: Today the Bank of England will simultaneously publish its May Inflation Report, the MPC policy decision and the MPC minutes (11:00 GMT). This will be followed by a press conference (11:30 GMT). We expect a comfortable majority of MPC members to vote in favor of maintaining the stance of monetary policy, but at least one member is likely to instead favor an immediate increase in the bank rate.
The main development in the last month or so is that real GDP growth slowed to just 0.3% qoq in the first quarter 2017 according to the preliminary estimate. That’s less than half the 0.7% qoq growth in the fourth quarter 2017 and materially lower than the BoE’s forecast of 0.6% qoq. The main reason behind the weakness is the slowdown in consumer services, particularly retail and accommodation, as higher inflation combined with weaker wage growth squeezes real household income growth.
The first view of the expenditure breakdown won’t be released until later this month, but the other components of demand (such as net exports) are not fully offsetting a consumer spending slowdown.
The most recent business surveys, for April, suggest that some of the weakness in the first quarter may prove temporary. The PMIs even accelerated, and the CBI survey of retail sales surprisingly rose to its highest level in 19 months, perhaps inflated by mild weather and Easter. However, on balance, the BoE is likely to revise down its near-term growth forecasts a touch and, at least, the mixed data argue for caution in setting policy.
On inflation, BoE staff projections are likely to be little changed, with a small upward revision to the near term and a small downward revision at the policy-relevant 2-3 year horizon. Inflation held at 2.3% yoy in March, higher than the BoE’s February Report forecast of 2.1% amid growing underlying inflationary pressure from past sterling depreciation. Partly offsetting this for the near-term outlook is that oil prices have dropped since the February report. The recent appreciation of the effective sterling index, of around 1.5% since late January, will likely mean a slightly smaller overshoot of the inflation target at the 2-3 year horizon.
The mixed data on growth and higher near-term inflation than expected are likely to mean further dissent at May meeting. Kristin Forbes (who leaves the MPC in June) will almost certainly continue to favor an immediate 25 bp increase in the bank rate, while Michael Saunders appears close to joining her. In a recent speech, Saunders said he expected growth and inflation to be higher than consensus expectations and warned:
I do not believe the MPC is necessarily obliged to delay any policy moves until we have certainty over the exact shape of Brexit and its long-run effects on the economy.
It comes after the March MPC minutes said that, among the majority who voted to maintain the stance of monetary policy:
Some members noted that it would take relatively little further upside news on the prospects for activity or inflation for them to consider that a more immediate reduction in policy support might be warranted.
The GBP/USD fell today after data showed UK industrial output data was sharply weaker than expected in March while the trade deficit widened sharply.
Industrial output fell by a monthly 0.5%. The manufacturing sector, which is part of overall industrial output, saw output fall by 0.6%, compared with market expectations of no change. Britain's goods trade deficit with the rest of the world widened to GBP 13.441 billion, bigger than the median forecast of GBP 11.8 billion. That took the total trade deficit - including Britain's surplus in services - for the first quarter to GBP 10.540 billion, more than double the shortfall in the fourth quarter.
Technical analysis: The rejection of the GBP/USD recovery yesterday and today’s slide suggests there is a chance for a deeper correction. The 23.6% fibo of April-May rise is support at 1.2842 and the 21-dma is close at 1.2833. 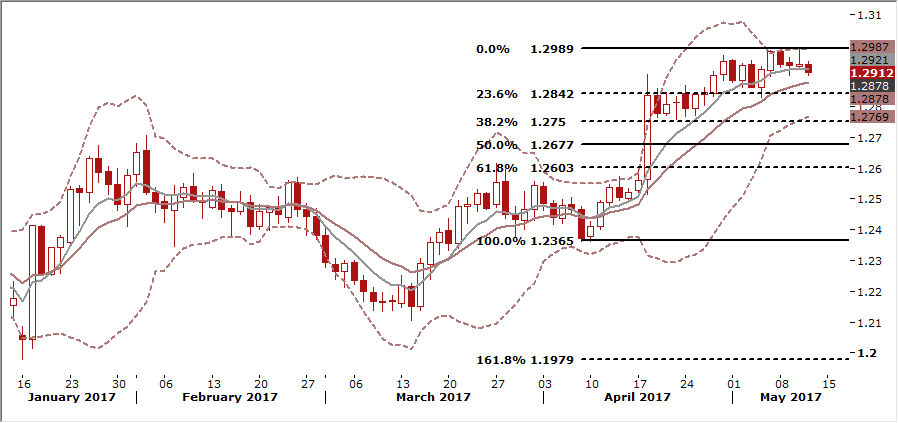
Short-term signal: Short in play, target 1.2750
Long-term outlook: Bullish
NZD/USD: RBNZ retains neutral bias
Macroeconomic overview: The Reserve Bank of New Zealand held its benchmark interest rate steady at 1.75% and retained its neutral bias, defying the expectations that it would lean toward a tightening of monetary policy in early 2019.
RBNZ Governor Graeme Wheeler said that a recent depreciation in the New Zealand dollar was:
encouraging, and if sustained, would help rebalance the growth outlook.
He reiterated his statement from the last two rate decisions in March and February that monetary policy "will remain accommodative for a considerable period of time."
Inflation accelerated to 2.2% in the first quarter, well above the RBNZ's projection of 1.5%. It was the first time since 2011 the bank had reached the midpoint of its target range. Wheeler said the increase in headline inflation in the March quarter was mainly due to temporary effects, particularly volatile petrol and food prices, and headline inflation would reach the midpoint of the 1%-3% target band over the medium term.
RBNZ Assistant Governor John McDermott said underlying inflation expectations in the country had not changed substantially from three months ago and the central bank has a neutral bias on interest rates.
The New Zealand dollar fell sharply immediately following the release of the Reserve Bank of New Zealand statement, dropping to 0.6819 from 0.6943 before the statement.
Technical analysis: The NZD/USD hit a fresh 11-month low after the release of the RBNZ statement. Despite some recovery attempts in the previous days, the bearish trend is continued. The pair is back below 14-day exponential moving average, which highlights the bearish structure. The NZD/USD broke the important long-term support level at .6861 (50% fibo of 2015-2016 rise). A close below this level may open the way to a stronger drop. 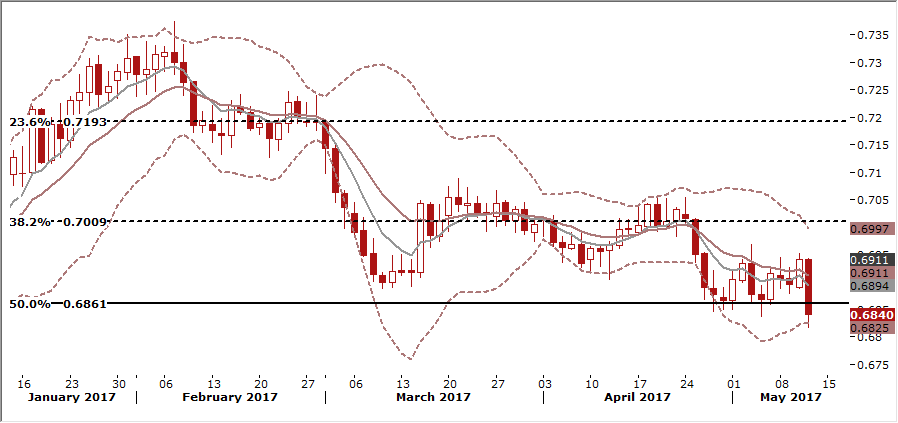
Short-term signal: Our long position was closed with a loss after the release of the RBNZ statement
Long-term outlook: Improving fundamentals of the New Zealand’s economy should result in NZD/USD appreciation in the long term.
TRADING STRATEGIES SUMMARY:
FOREX - MAJOR PAIRS: 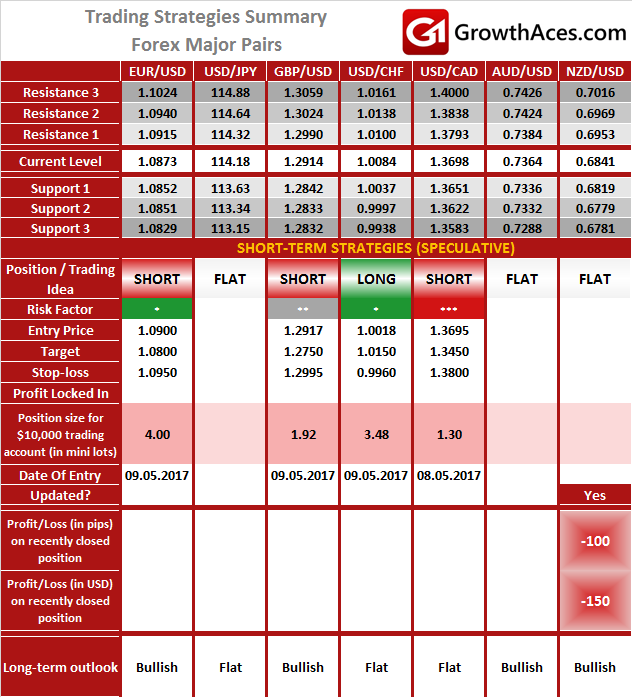
FOREX - MAJOR CROSSES: 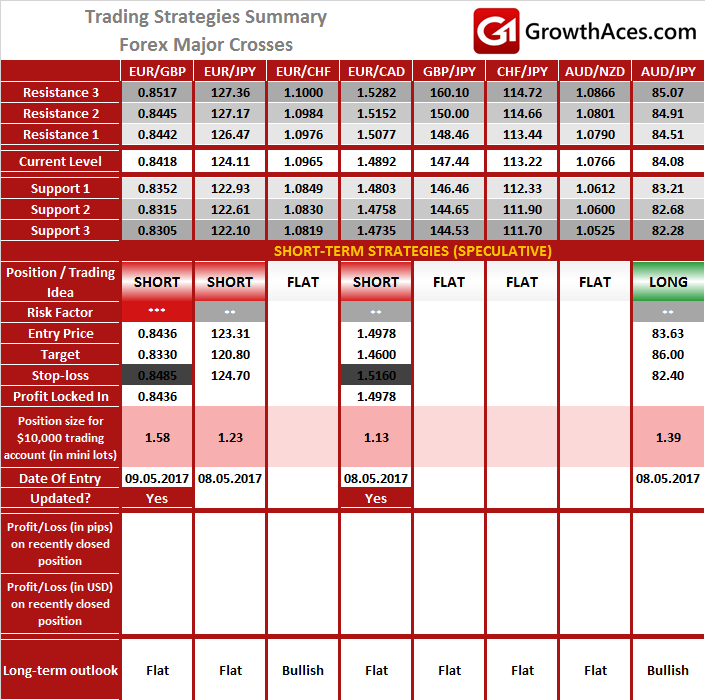
PRECIOUS METALS: 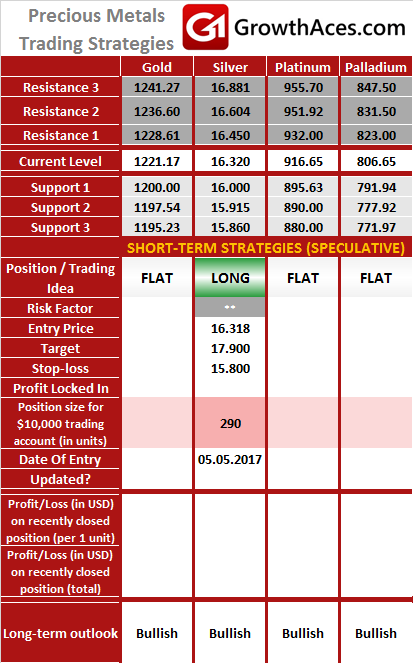
How to read these tables?
1. Support/Resistance - three closest important support/resistance levels
2. Position/Trading Idea:
BUY/SELL - It means we are looking to open LONG/SHORT position at the Entry Price. If the order is filled we will set the suggested Target and Stop-loss level.
LONG/SHORT - It means we have already taken this position at the Entry Price and expect the rate to go up/down to the Target level.
3. Stop-Loss/Profit Locked In - Sometimes we move the stop-loss level above (in case of LONG) or below (in case of SHORT) the Entry price. This means that we have locked in profit on this position.
4. Risk Factor - green "*" means high level of confidence (low level of uncertainty), grey "**" means medium level of confidence, red "***" means low level of confidence (high level of uncertainty)
5. Position Size (forex)- position size suggested for a USD 10,000 trading account in mini lots. You can calculate your position size as follows: (your account size in USD / USD 10,000) * (our position size). You should always round the result down. For example, if the result was 2.671, your position size should be 2 mini lots. This would be a great tool for your risk management!
Position size (precious metals) - position size suggested for a USD 10,000 trading account in units. You can calculate your position size as follows: (your account size in USD / USD 10,000) * (our position size).
6. Profit/Loss on recently closed position (forex) - is the amount of pips we have earned/lost on recently closed position. The amount in USD is calculated on the assumption of suggested position size for USD 10,000 trading account.
Profit/Loss on recently closed position (precious metals) - is profit/loss we have earned/lost per unit on recently closed position. The amount in USD is calculated on the assumption of suggested position size for USD 10,000 trading account.
Source: GrowthAces.com - your daily forex trading strategies newsletter
