GBP/USD breakout needs confirmation
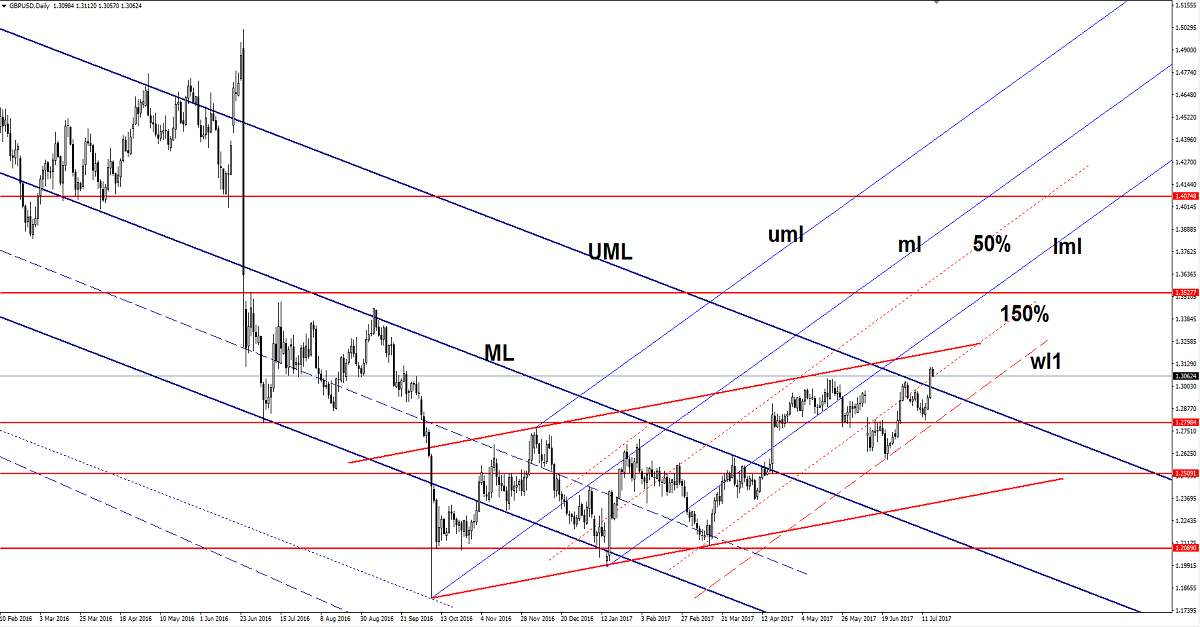
The GBP/USD is trading in the red right now after the failure to resume the upside momentum, a minor decrease is natural after the impressive rally. It has failed to climb above the 1.3112 Friday’s high, the bears have stepped in and have taken the lead on the short term. It remains to see how long this will be, could come down only to test and retest the broken resistance before will resume the upside movement.
The perspective remains bullish on the Daily chart, personally I’m waiting for a fresh trading signal that could come in the upcoming days if the broken resistance will hold.
We have a poor economic calendar today, the rate is driven by the technical factors, so the minor decrease is understandable. The US is to release only the Empire State Manufacturing Index, which could decrease from 19.8 to 15.2 points in July.
Price drops after the failure to reach and retest the upside line of the ascending channel, is pressuring the 150% Fibonacci line (ascending dotted line), could come down to test and retest the broken upper median line (UML) of the major descending pitchfork.
Is also approaching the 1.3000 psychological level, we may have a buying opportunity if will stay above the upper median line (UML) and above the first warning line (wl1) of the minor ascending pitchfork.
Personally, I’m still waiting for a confirmation that will increase further, you can see that we had another false breakout above the UML in the past. The sentiment will change drastically on the GBP/USD if the rate will stabilize above the UML, a major rebound will come if this scenario will happen.
Is very important to see what will happen on the USDX these days because is under massive selling pressure on the short term and could approach the 95.00 psychological level in the upcoming days.
USD/CHF turned to the downside again
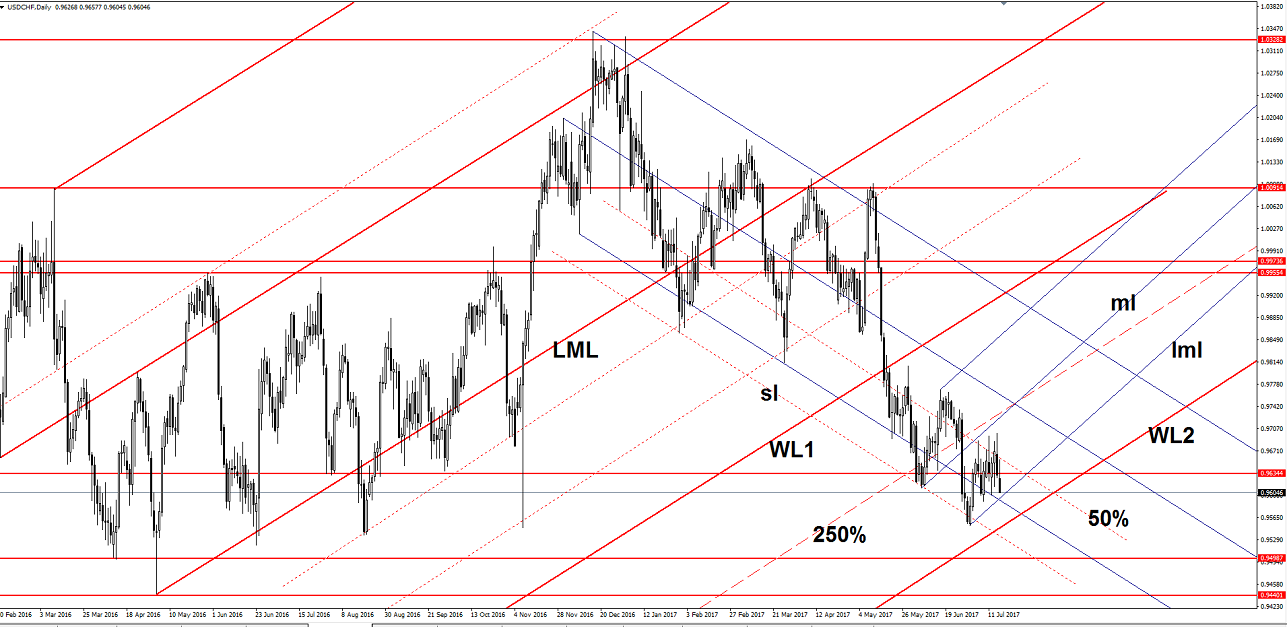
The currency pair has dropped aggressively since Friday and is targeting new lows on the Daily chart, is strongly bearish as the USDX stay in the seller’s territory. Technically should drop further after a false breakout.
USD/CHF goes down after the false breakout above the 50% Fibonacci line (descending dotted line), also failed to stay above the 0.9634 static resistance and now looks determined to approach the 0.9551 previous low.
Support could be found at the lower median line of the descending pitchfork and at the lower median line (lml) of the minor ascending pitchfork, a breakdown below these levels will send the rate towards the second warning line (WL2) of the major ascending pitchfork.
EUR/JPY eyeing a crucial breakdown
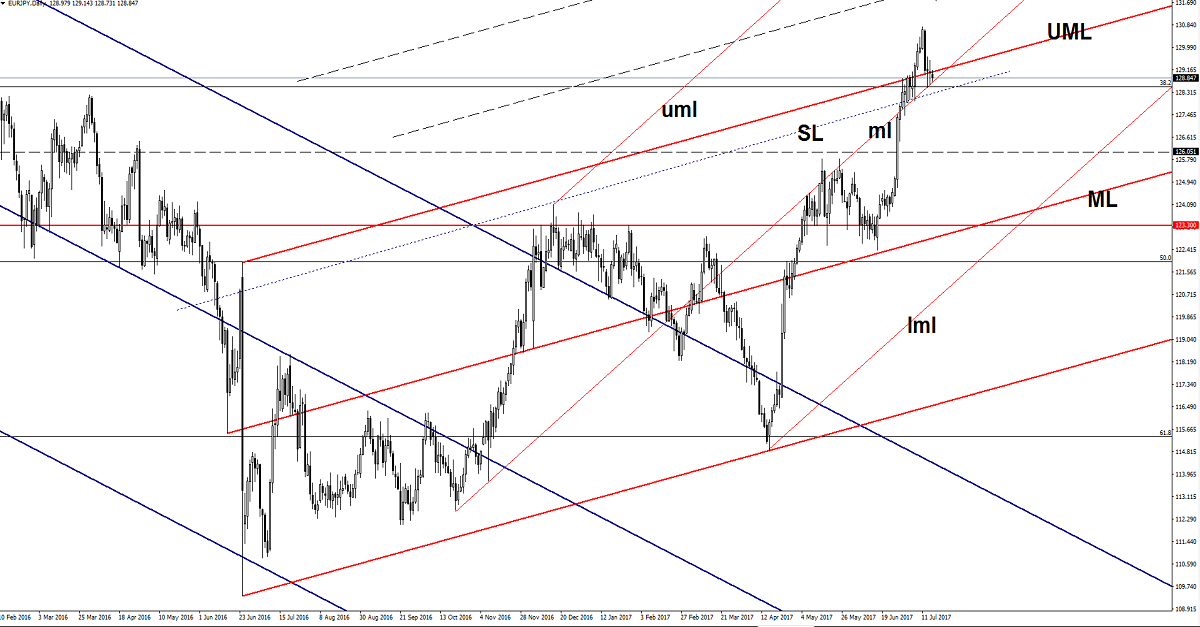
EUR/JPY is into a corrective phase on the Daily chart, this is natural after the amazing rally, has come back to test and retest the upper median line (UML) on the major ascending pitchfork, the median line (ml) of the minor ascending pitchfork and the 38.2% retracement level, a valid breakdown below these levels will open the door for more declines. However, we’ll have a buying opportunity if will climb above the 129.30 level again.


