The U.S. dollar was seen consolidating on Monday ahead of the two-day FOMC meeting that starts today. The lack of economic data kept the greenback in check as investors await tomorrow’s FOMC rate hike decision. The Kiwi dollar was seen posting strong gains on Monday after the appointment of the new RBNZ Governor, Adrian Orr.
Looking ahead, the economic data today will include the UK's inflation report for November. According to the median forecasts, inflation in the UK is expected to have risen at a steady pace of 3.0% in November. Core inflation rate is also expected to be steady at 2.7%. This comes after the BoE's rate hike in early November.
In the U.S. the producer price index data is expected to show a 0.4% increase, rising at the same pace as the month before. Core PPI is expected to slow, rising just 0.2% down from 0.4% increase previously. The ECB president Mario Draghi is expected to speak later this evening.
EUR/USD intra-day analysis

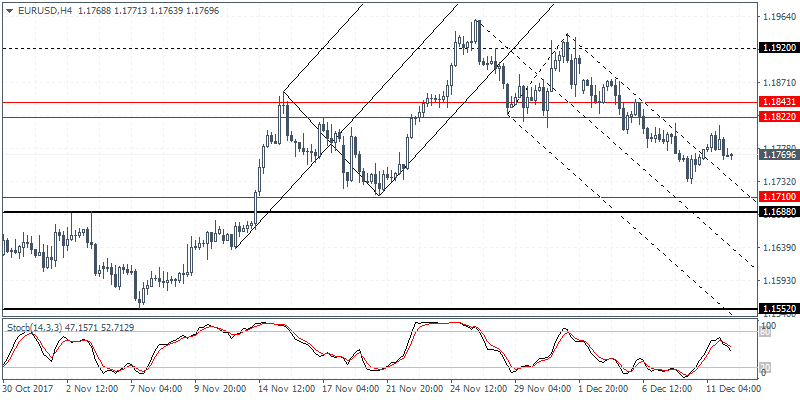
EUR/USD (1.1769):The EUR/USD was trading flat although intraday volatility picked up. Price action spiked to a two-day high, but the gains were short lived. We expect that the sideways price action will continue in the short term. As long as EUR/USD remains supported above the 1.1704 support level, the bias remains to the upside. On the 4-hour chart, EUR/USD will need to post a higher low in order for price to test the resistance level area near 1.1843 - 1.1822 region. Establishing resistance at this level will signal a short term retracement. However, we expect to see price action resume its decline on a reversal near the resistance level.
USD/JPY intra-dayanalysis

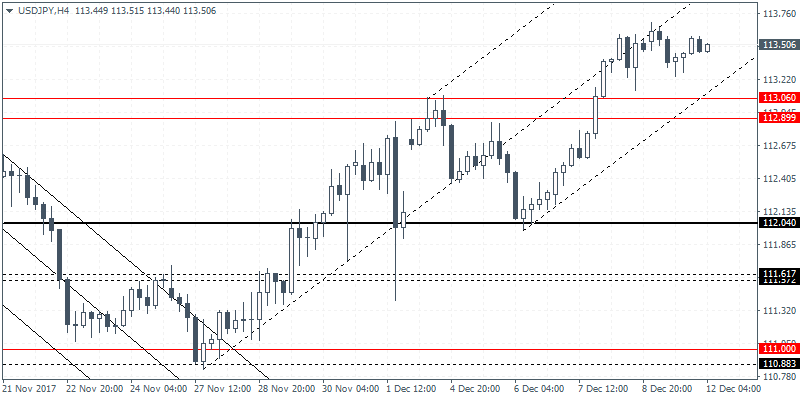
USD/JPY (113.50):The USD/JPY attempted to post further gains but with price action closing with a doji candlestick pattern on the daily chart, we expect the rally to stall in the short term. The downside bias is increasing as a retest of the support level area near 113.06 - 112.90. This remains as the most likely price level that could be tested for support. Further gains can be expected after USD/JPY will establish support at this level. In the event that the support level fails, we could expect to see further declines that could push USD/JPY lower towards 112.04 support.
NZD/USD intra-day analysis

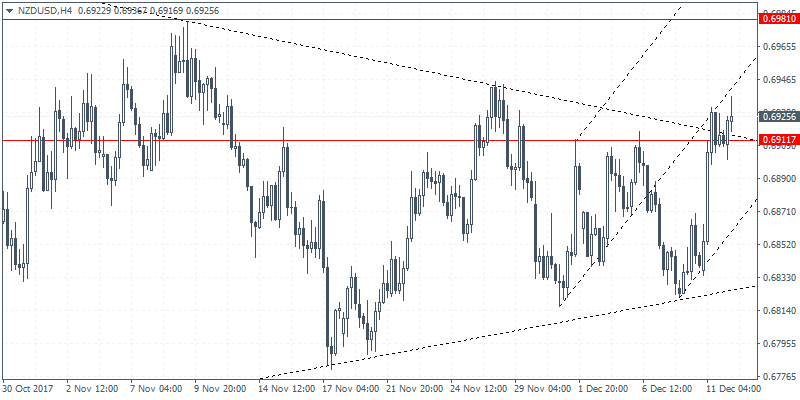
NZD/USD (0.6925):The NZD/USD currency pair closed bullish yesterday as price action is looking to maintain the bullish momentum. Following the consolidation off the triangle pattern formed near the bottom, NZD/USD is seen attempting to breakout to the upside. Short term resistance at 0.6911 remains key and a bullish close above this level could signal further gains. On the 4-hour chart, price action is biased to the upside. Short term consolidation near 0.6911 could remain in play. The next resistance level is identified near the 0.6981 level which could be breached if the kiwi dollar maintains the bullish momentum.
