
Garmin Ltd. (NASDAQ:GRMN) reported better-than-expected results for the first quarter of 2018 with revenues and earnings surpassing the Zacks Consensus Estimate.
Earnings of 68 cents per share beat the consensus mark by 12 cents. Earnings were down 14% sequentially but up 31% year over year.
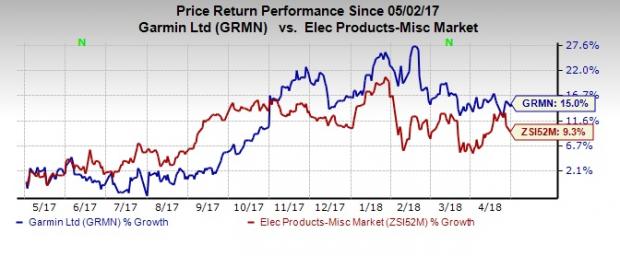
Management focuses on continued innovation, diversification and market expansion to explore growth opportunities in all its business segments. However, macroeconomic challenges remain part of the operating environment. We observe that shares of Garmin have gained 15% in the past 12 months, outperforming the industry’s 9.3% rally.
Let’s delve deeper into the numbers.
Revenues
Garmin’s first-quarter revenues of $710.9 million beat the Zacks Consensus Estimate of $668.8 million, down 20% sequentially but up 10.8% from the prior-year quarter. The year-over-year increase was backed by higher demand across fitness, outdoor, marine and aviation segments.
Segmental Revenues
Garmin’s Outdoor, Fitness, Marine, Auto/Mobile and Aviation segments generated 20%, 23%, 16%, 20% and 21% of quarterly revenues, respectively. Seasonality results in considerable variations in Garmin’s quarterly revenues.
Outdoor revenues were down 29% sequentially but up 24.5% year over year. The year-over-year increase was driven mainly by robust demand for wearables.
The Fitness segment decreased 39.9% sequentially but increased 20.5% from the year-ago quarter. The year-over-year increase was driven by GPS-enabled products.
The Marine segment increased 35.7% sequentially and 8.7% year over year. The year-over-year growth was driven by strength in chartplotter and fish finder products. Also, Navionics’ acquisition added to the growth.
The Auto/Mobile segment was down 27.7% sequentially and 11.9% on a year-over-year basis. The year-over-year decrease was mainly due to shrinking of the personal navigation device (PND) market, partially offset by OEM growth and strength in niche categories such as fleet, camera, truck and RV.
Aviation segment revenues were up 12.3% sequentially and 18.6% from the prior-year quarter. The increase was mainly driven by higher sales of aftermarket products and positive contributions from OEM products.
Revenues by Geography
While America generated 49% (down 18.9% sequentially but up 6.6% year over year) of the total revenues, EMEA and APAC contributed 35% (down 27.9% from the prior quarter but up 9.1% from the year-ago quarter) and 16% (down 1.7% sequentially but up 30% from the prior-year quarter), respectively.
Operating Results
Gross margin was 60%, up 190 basis points (bps) from the year-ago quarter. Stronger demand drove volumes across all its segments except Auto, pulling down segmental gross margins on a year-over-year basis.
Operating expenses of $284 million were up 11% from $255.8 million in the year-ago quarter.
GAAP net income was $129.4 million or 68 cents per share compared with $149.8 million or 79 cents per share a year ago.
Balance Sheet
Inventories were up 6% sequentially to $547.4 million. Cash and marketable securities were approximately $1.07 billion, compared with $1.05 billion in the last reported quarter. The company has no long-term debt.
As of Mar 31, the company generated cash flow of $214.2 million from operating activities and free cash flow of $187.9 million.
2018 Guidance
For full-year 2018, management maintained revenue guidance of $3.2 billion and pro-forma earnings of $3.05 per share. The Zacks Consensus Estimate for revenues and earnings for 2018 is pegged at $3.20 billion and $3.06 per share, respectively.
Garmin Ltd. Price, Consensus and EPS Surprise
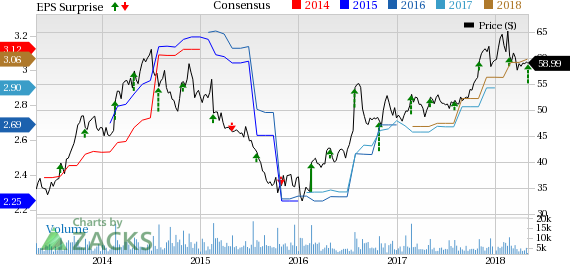
Garmin Ltd. Price, Consensus and EPS Surprise | Garmin Ltd. Quote
Zacks Rank and Other Stocks to Consider
Garmin currently carries a Zacks Rank #2 (Buy). Other top-ranked stocks in the technology sector are SMC Corporation (OTC:SMCAY) , Etsy, Inc. (NASDAQ:ETSY) and Littelfuse, Inc. (NASDAQ:LFUS) , each carrying a Zacks Rank #2. You can see the complete list of today’s Zacks #1 Rank (Strong Buy) stocks here.
Long-term earnings per share growth rate for SMC Corporation, Etsy and Littelfuse is projected at 13.7%, 17.3% and 12%, respectively.
Looking for Stocks with Skyrocketing Upside?
Zacks has just released a Special Report on the booming investment opportunities of legal marijuana.
Ignited by new referendums and legislation, this industry is expected to blast from an already robust $6.7 billion to $20.2 billion in 2021. Early investors stand to make a killing, but you have to be ready to act and know just where to look.
See the pot trades we're targeting>>
Etsy, Inc. (ETSY): Free Stock Analysis Report
Littelfuse, Inc. (LFUS): Free Stock Analysis Report
Garmin Ltd. (GRMN): Free Stock Analysis Report
Smc Corporation (SMCAY): Free Stock Analysis Report
Original post
Zacks Investment Research