On the day after the U.S. Federal Reserve’s announcement that it will scale back quantitative easing, or QE, by $10 billion a month starting in January, gold slipped below the $1,200 an ounce mark for the first time in 6 months, with the spot price trading around $1,196 in New York.
The Fed for months has been musing about when to scale back its quantitative easing program, the $85 billion a month stimulus package that since 2008 has pumped some $4 trillion into the U.S. economy in order to keep interest rates low and prevent the country from falling back into recession. But, an improved economic picture in the United States, particularly on the jobs front, has lessened the need for stimulus and increased pressure on the central bank to taper its monthly bond purchases, which due to the program’s inflationary nature, has been exceedingly bullish for gold. Since the program started in 2008, the bullion price has more than doubled, and only in the past 12 months has it significantly slipped.
In a recent article published in Seeking Alpha I asked Dr. Marc Faber if the US economy strong enough to provide the Fed an exit strategy? And he said:
“Basically we have the same things since November 2008 when QE was introduced the first time. At that time they were talking about an exit strategy. You will never hear about an exit strategy today. They talk about maybe tapering. When they started in 2008, my argument was, believe me we are going to go to QE 99. We are never going to stop the program because when governments introduce new programs under the excuse of urgency to fix something usually these programs stay in place for a very long time. And all this talk about tapering, maybe they’ll do a kind of cosmetic tapering at some point, like actually I have to say as of today this year alone, the FED’s have bought more than $1 tn worth of treasuries and mortgage backed securities because they not only have this $85 bn of asset programs but they also have the accruing interest to invest. So they bought much more than they have made public. Now, can they go down from a purchase of $85 bn?… Yes, it’s going to be cosmetic. As soon as the economy weakens again, as soon as there is an economic crisis, they will go to $150 bn a month or more.”
Will higher interest rates be the norm and cause a stock market crash in 2014?
If we take a look at the 1987 crash, when the Dow Industrial Average lost 508 points or 22% of its value, we can clearly see that the panic was perpetuated by a sharp rise in interest rates. Likewise, another stock market crash awaits investors on the other side of tapering.
Michael Pento from Pento Portfolio Strategies LLC made the following remarks:
“Rising interest rates twenty six years ago were a direct result of surging inflation. The year 1987 started out with very benign inflation. Consumer Price Inflation in January of that year showed that prices were up just 1.4% from the year ago period. However, CPI inflation surged to an annual increase of 4.4% by October. Rapidly rising inflation put fear back in the minds of the bond vigilantes, who remembered vividly how the former Fed Chairman, Paul Volcker, had to raise the Fed Funds Rate to nearly 20% in order to vanquish inflation just six years prior. The worry was that the new Chairman, Alan Greenspan, would soon be forced to follow in his predecessor’s footsteps and start aggressively raising the Funds Rate. That fear helped send the Ten-Year Note yield surging from just above 7%, in January 1987, to over 10.2%, the week before BlackMonday.
The stock market had soared by 22% in the 12 months prior to the crash of ’87. In similar fashion, the Dow Jones Industrial Average has risen 21% since December of 2012, and is up nearly 150% since March of 2009. Of course, many pundits like to claim the market is not as overvalued now as it was then–the PE ratio was 23 in ’87, while it is 16 today.”
Are we looking at the end of the gold market’s 13 year bull run or the completion of this multi-year correction?
Gold’s initial reaction wasn’t quite what you’d expect. Volatile was the best way to describe it. After the taper announcement late Wednesday, prices for gold fell in electronic trading from its settlement price on Comex, recouped that decline to trade higher, only to fall back even more. By Thursday’s close, prices lost over 3% to finish at a more than three-year low under $1,200 an ounce.
Technically speaking, pundits seem to expect the price of gold will drop to the $1000 price levels in the paper markets (futures), but the fundamentals for gold have never been better.
In my last interview with Eric Sprott, I asked Eric if he thought China will continue to import physical gold at the same rates as they have this past year?..And he said:
“That’s a great question. I just was off the phone with someone from the World Gold Council who is a Chinese expert and they are sticking by that their GFMS data that the World Gold Council publishes is correct. This person said he has a pretty good idea of what goes on in Chinese jewelry demand. Two years ago China imported 100 tons gold into mainland China and this year they are probably running at a 1200 ton rate, so in two years they have gone up 1100 tons. If you, Mr. China expert, know what’s going on in jewelry demand in China, then you can look at the change in demand in jewelry from 11 to 13, take it off the 1100 ton increase and you must make some conclusion of where it’s going. But they don’t want to do that and the obvious “where it’s going” part is either substantial savers in China or the People’s Bank of China and I suspect it’s a combination of both. Nobody wants to say it’s true until someone comes out and confirms it even though there is an unexplained difference. We have an 1100 ton change in Chinese demand which is 29 percent of the total gold market which is a 4000 ton market and nobody seems to be willing to explain it and yet every year they come out and say demand equals supply which I don’t believe the data for a second. I think that the demand is way beyond the supply of gold and that the western banks have been involved in supplying that gold non-transparently. And as you and I and all your listeners know that zero interest rates and printing money is financially irresponsible; we all know it. I can assure you Ben Bernanke Knows it, Julia Coronado knows it, Rene Carne knows it, and Mario Draghi knows it. They know it’s irresponsible; they just have to do it to try to get through to the next crisis because if they didn’t print rates would be up already and we would be in Armageddon.”
Are higher interest rates bearish for gold?
Most people have the general conception that higher interest rates are negative for the price of gold and silver. When you take a look at the Fed’s balance sheet debt levels and the current monetary policies, it seems to indicate that the US economy is at a very vulnerable place. Any real economic growth that would prove itself to be real would put more pressure on the Fed to raise the Fed funds rate in order to control the velocity of money going into the economy and offset any inflationary expectations by raising rates. The stronger the economy the more pressure on the Fed to raise rates. This causes a domino reaction throughout the world economies as more pressure is put on to pay the interest on sovereign debt as well as the public and private sector become increasingly difficult to manage its financing costs. There are many alternatives as we come off record low interest rates and the need for economic growth might serve well for the focus of main street demand to shift the attention to gold and silver currently trading at multi-year lows.
Will gold rally from current levels into 2014?
The gold and silver markets are entering a very strong cyclical time when a multi-year cyclical low is possible. The gold and silver markets are on track from the overall decline of the late-Aug period into the late December time frame and for a 2 month decline from October 28, into the late December time frame. The next time frame comes into play on Dec 23/24 where we can expect that a major bottom is most likely.
Let’s take a look at the gold and silver futures (paper) markets and see what we can anticipate for next week of trading.
GOLD
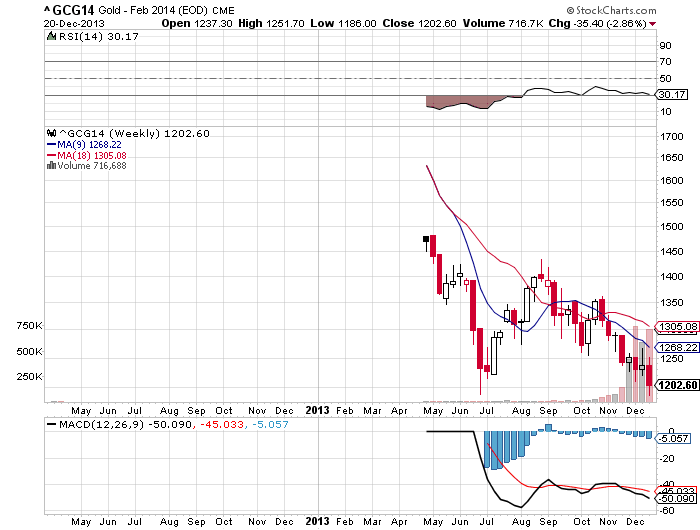
The December gold futures contract closed at 1203 . The market closing below the 9 MA (1268) is confirmation that the trend momentum is bearish. A close above the 9 MA would negate the weekly bearish short-term trend to neutral.
With the market closing below the VC Weekly Price Momentum Indicatorof 1214, it confirms that the price momentum is bearish. A close above it would negate the bearish signal to neutral.
Cover short on corrections at the 1175 to 1142 levels and go long on a weekly reversal stop. If long, use the 1142 level as a Stop Close Only and Good Till Cancelled order. Look to take some profits on longs, as we reach the 1241 and 1280 to levels during the week.
SILVER
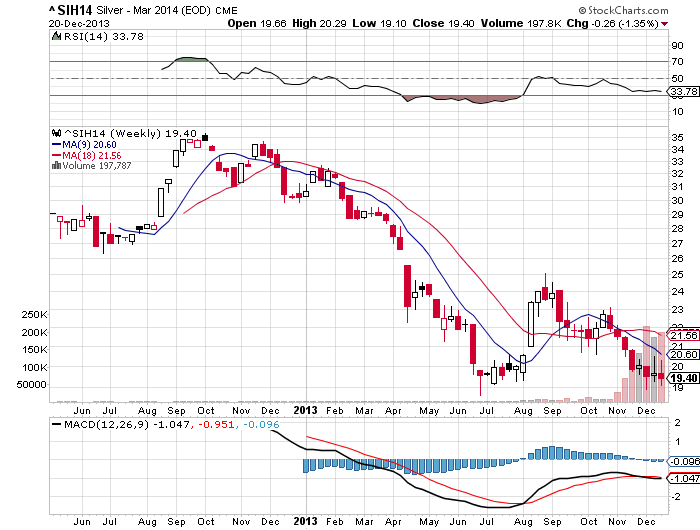
The December Silver futures contract closed at 19.40. The market closing below the 9 day MA (20.60) is confirmation that the trend momentum is bearish. A close above the 9 MA would negate the weekly bearish short-term trend to neutral.
With the market closing below the VC Weekly Price Momentum Indicator of 19.60, it confirms that the price momentum is bearish. A close above it would negate the bearish signal to neutral.
Cover short on corrections at the 18.90 to 18.40 levels and go long on a weekly reversal stop. If long, use the 18.40 level as a Stop Close Only and Good Till Cancelled order. Look to take some profits on longs, as we reach the 20.09 to 20.78 levels during the week.
Disclaimer: The information in the Market Commentaries was obtained from sources believed to be reliable, but we do not guarantee its accuracy. Neither the information nor any opinion expressed therein constitutes a solicitation of the purchase or sale of any futures or options contracts


