
Francesca's Holdings Corporation (NASDAQ:FRAN) reported third-quarter fiscal 2018 results, with the top and the bottom line surpassing estimates but declining year over year. Moreover, comparable store sales (comps) decreased year over year, marking the seventh straight quarter of comps decline. Further, management lowered outlook for fiscal 2018 and provided soft view for the fourth quarter, which hurt investors’ sentiments.
Notably, shares of the company plunged more than 16% on Dec 11. Moreover, this Zacks Rank #4 (Sell) stock has lost 52.6% in the past three months, underperforming the industry’s 13% decline.
Q3 Highlights
Francesca's adjusted loss of 17 cents per share (excluding non-recurring items) for third-quarter fiscal 2018 compared unfavorably with earnings of 1 cent in the year-ago quarter. However, the bottom line was narrower than the Zacks Consensus Estimate of a loss of 18 cents.
Net sales declined 9.8% to $95.4 million from $105.8 million in the prior-year quarter, primarily due to decline in comps. However, net sales surpassed the Zacks Consensus Estimate of $94.9 million. Comps declined 14% in the quarter due to soft boutique traffic, partially offset by sales from 24 net new boutiques added since the year-ago period.
Francesca's Holdings Corporation Price, Consensus and EPS Surprise
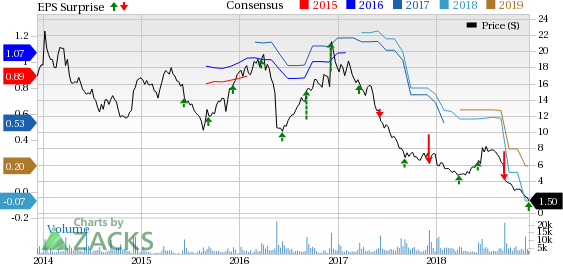
Francesca's Holdings Corporation Price, Consensus and EPS Surprise | Francesca's Holdings Corporation Quote
Sales from Apparel business decreased 11.5% to $48.4 million, while sales from Accessories business declined 3.4% to $14.8 million. Sales from Gifts business fell 20.5% to $8.7 million, whereas sales from other categories plunged 70.6% to $0.6 million. However, sales from Jewelry business was almost flat at 22.9 million.
Gross profit decreased 19.6% year over year to $33.6 million, while gross profit margin contracted 430 basis points (bps) to 35.3%. Meanwhile, operating loss came in at $23.1 million, against operating profit of $0.5 million in the third quarter last year.
Store Update
During the fiscal third quarter, Francesca's Holdings did not open any new boutiques but closed four, bringing the total boutique count to 738. These consist of 352 mall locations and 386 non-mall locations, of which 90 are outlets. During the fourth quarter, the company intends to open a boutique and close 11 existing boutiques, mostly in January.
For fiscal 2018, Francesca's Holdings plans to open 32 boutiques, close 25 boutiques and refresh 81 boutiques.
Other Financial Aspects
Francesca's Holdings ended the fiscal third quarter with cash and cash equivalents of $10.7 million, with no debt outstanding, and total shareholders’ equity of $94.8 million. Cash flow from operations amounted to $5.8 million in the first three quarters of fiscal 2018.
Capital expenditures were $21.9 million year to date, which included $8.4 million for new boutiques, $8.9 million for remodels and $2 million for existing boutiques. For fiscal 2018, the company expects capital expenditure to be around $30 million.
Outlook
Following a soft third quarter, the company provided a soft outlook for the fiscal fourth quarter and trimmed its view for fiscal 2018. For fourth-quarter fiscal 2018, management anticipates net sales of $118-$124 million, with 10-15% decrease in comps. Further, the company anticipates adjusted loss of 7-14 cents per share.
Fiscal 2018, net sales are expected to be $427-$433 million, compared with the prior-year net sales of $471.7 million. Comps are expected to fall mid-to-low teens with adjusted loss per share of 34-41 cents. Earlier, Francesca's Holdings envisioned net sales between $453 million and $463 million, with comps decreasing 8-10%. Further, the company expects adjusted earnings per share of 15-25 cents.
3 Stocks to Watch
Rocky Brands (NASDAQ:RCKY) delivered average positive earnings surprise of 53.3% in the trailing four quarters and sports a Zacks Rank #1 (Strong Buy). You can see the complete list of today’s Zacks #1 Rank stocks here.
Deckers Outdoor Corporation (NYSE:DECK) delivered average positive earnings surprise of 69.1% in the trailing four quarters. It has long-term earnings growth rate of 11.3% and a Zacks Rank #2 (Buy).
L Brands, Inc (NYSE:LB) has long-term earnings growth rate of 11.5% and a Zacks Rank of 2.
Looking for Stocks with Skyrocketing Upside?
Zacks has just released a Special Report on the booming investment opportunities of legal marijuana.
Ignited by new referendums and legislation, this industry is expected to blast from an already robust $6.7 billion to $20.2 billion in 2021. Early investors stand to make a killing, but you have to be ready to act and know just where to look.
See the pot trades we're targeting>>
L Brands, Inc. (LB): Free Stock Analysis Report
Francesca's Holdings Corporation (FRAN): Free Stock Analysis Report
Deckers Outdoor Corporation (DECK): Free Stock Analysis Report
Rocky Brands, Inc. (RCKY): Free Stock Analysis Report
Original post
Zacks Investment Research