All my market opinions reflect my own trading behavior, this behavior is based on.
Elliott waves law. My opinion cannot be considered as an investment advice and may or may not match with market opinions of other trading2day.com authors.
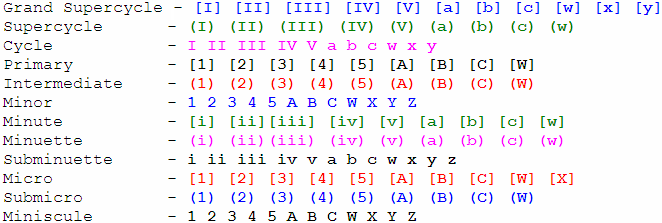
Waves labels table. Degree of our waves on charts may or may not match with yours, it is not an error.
Chinese Yuan offshore and onshore, USD/CNH, spot.
While major european currencies are still struggling to top against US dollar we take a look at another part of the world, China and Japan.
China has a single currency, but this country conducts vivid export-import operations, international trading in its turn leaves a lot of cash and noncash yuans abroad. So, there are two main lots of yuan, internal money mass and money mass outside of China. Internally traded yuan is often called onshore CNY, externally(mainly in Hong Kong), offshore CNH. The People’s Bank of China governs internal foreign exchange market and may intervene in any external bourse. Rates on both markets may have some differences, which offer two different views on the same object, helping us to find a right waves count.
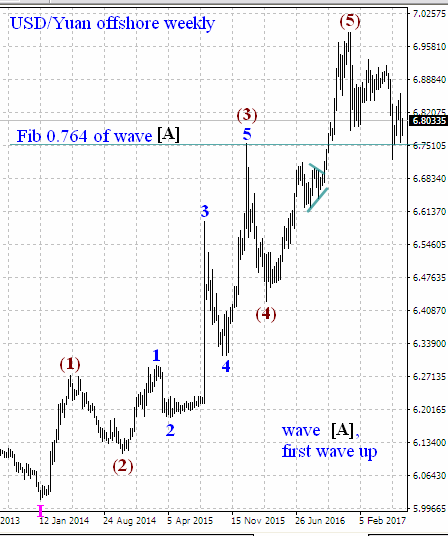
Long term yuan appreciation was in five waves form and has ended at early January 2014.
We have marked this appreciation as wave I. Since then we can see a clear five waves up of a lesser degree. Now we suppose, that yuan appreciation has faced a correction [A]-[B]-[C].
Once this correction will be over, yuan will continue its rise against US dollar in wave III.
This is our current long term model. First wave [A] is over, now we deal with wave [B].
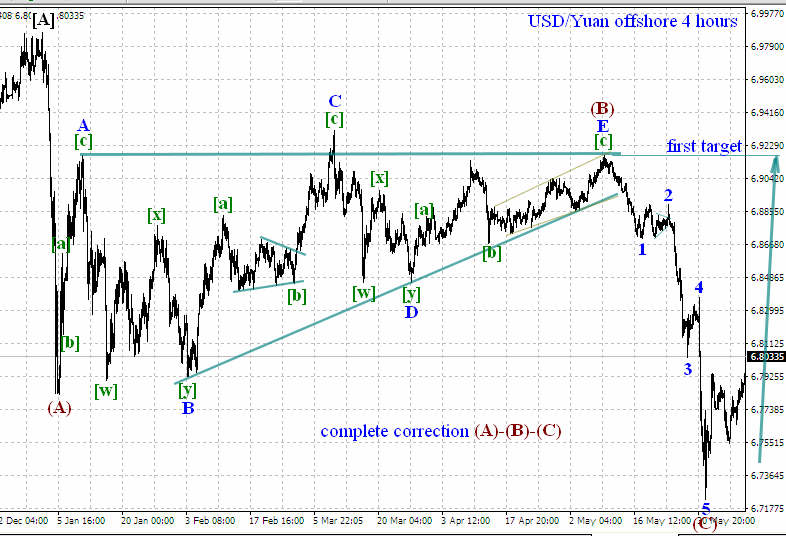
Let us look at wave [B]. It is a three waves move (A)-(B)-(C). Corrective triangle in the middle divides all downward move into clearly visible impulses (A) and (C). Our waves count for wave (C) tells us, that the whole corrective move is already over. What kind of next move should we wait? Now it is unknown if wave [B] is already over. Three waves downward move looks too short in time and too shallow in price, it may be
1) A complete wave [B], price continue to rise in wave [C].
2) A first wave (A) of a flat surface [B], next rise in wave (B).
3) A first wave (A) of a triangular wave [B], next rise in wave (B).
4) A first wave (W) of a double zigzag [B], next rise in wave (X).
We can hope for a rise from the current level until the end of triangular wave (B), because triangles usually attract reversal price moves. We can BUY USD against yuan at the current level and hold this BUY until the first target, wave (B) end. We could hold this position all the wave [B], but a current swap rate for long positions on USD/Yuan is high enough.
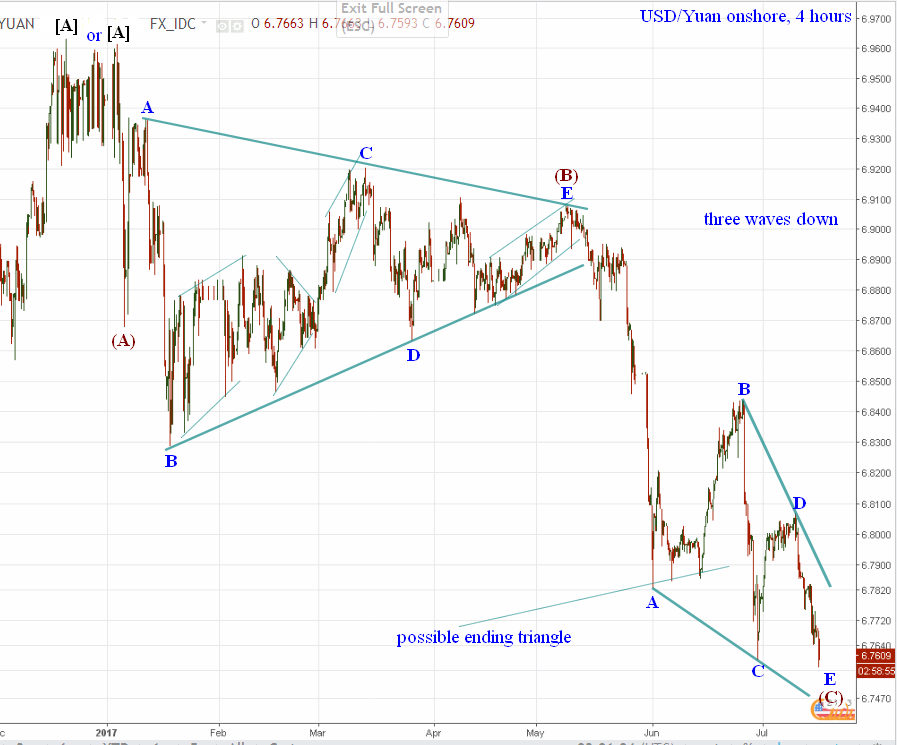
The same three waves for onshore yuan. Probably, the last move (C) is an ending triangle.
Both charts for offshore and onshore yuan show us correction end. But maybe wave [B] is not over yet?
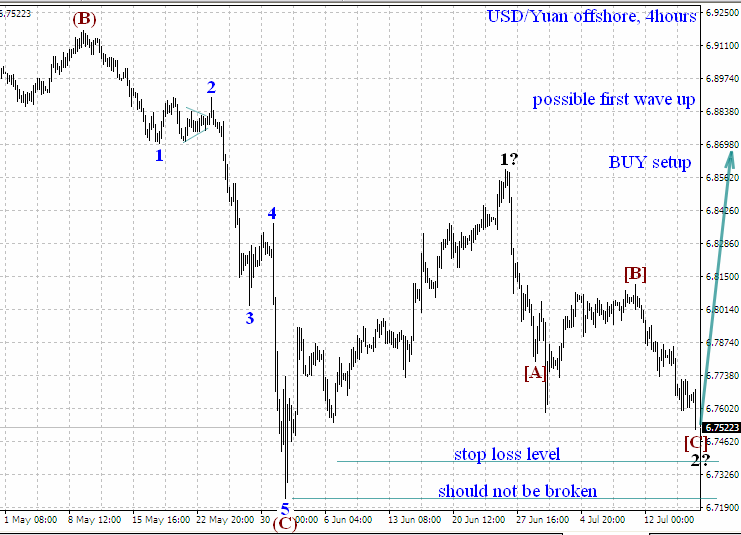
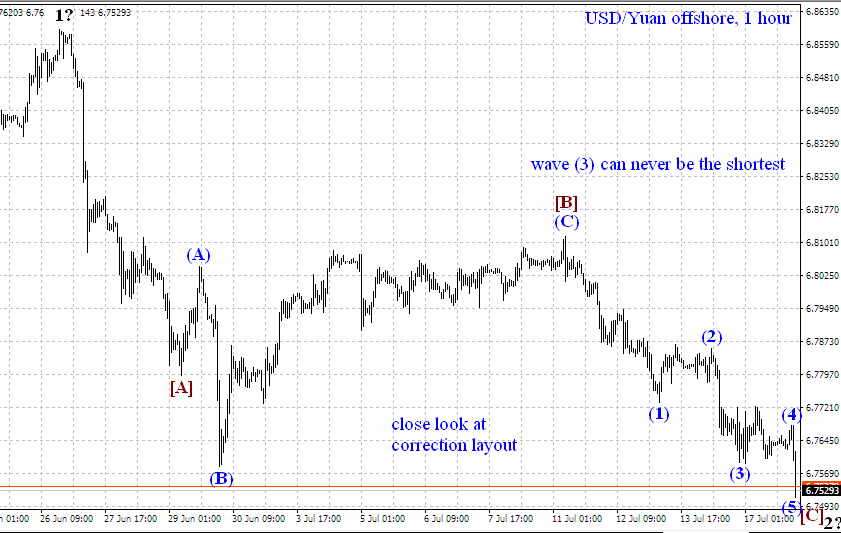
Close look at offshore yuan. We suppose, that the first wave up has already started. It may be a place for a short term BUY. We have drawn our layout for a BUY setup. Stop loss level is a place, where the last wave form becomes invalid.
USD/JPY, spot.
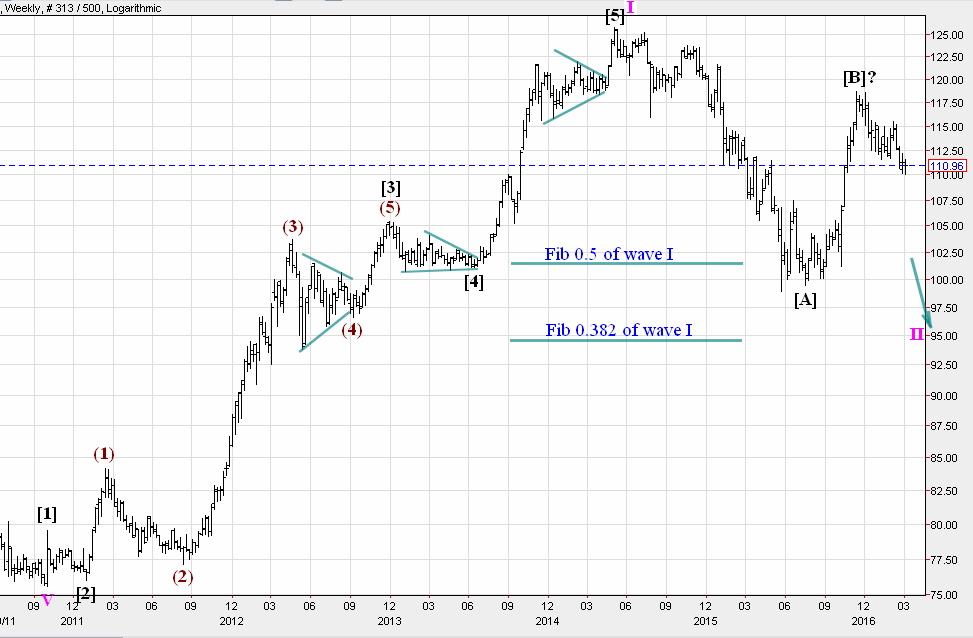
First rise on USD/JPY after the years of fall, obvious wave I. Move up will go on after wave II. We should find wave II end.
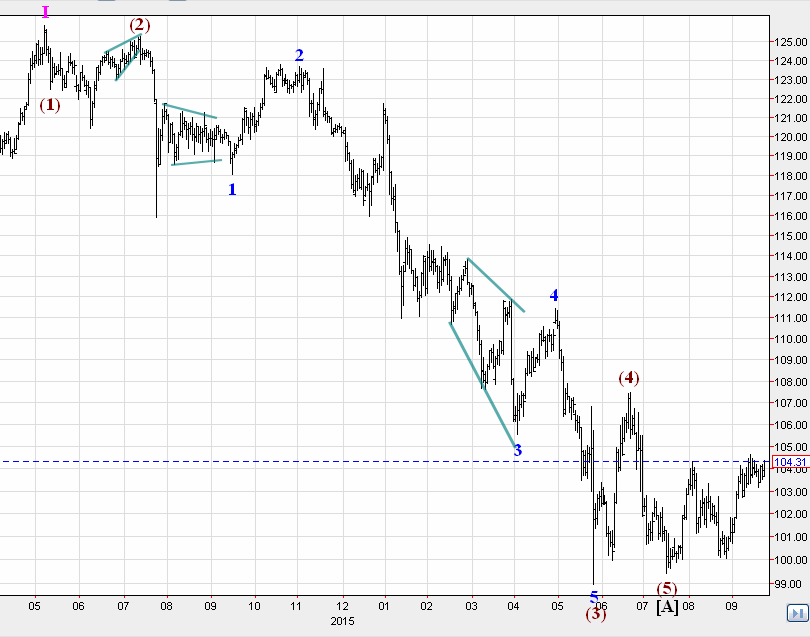
Our careful count for a first move down in wave II. Wave form is not clearly visible, we do suppose, that this is a five waves impulse, but our assurance is not high. In the case of three waves, we would have a flat surface in wave II place.
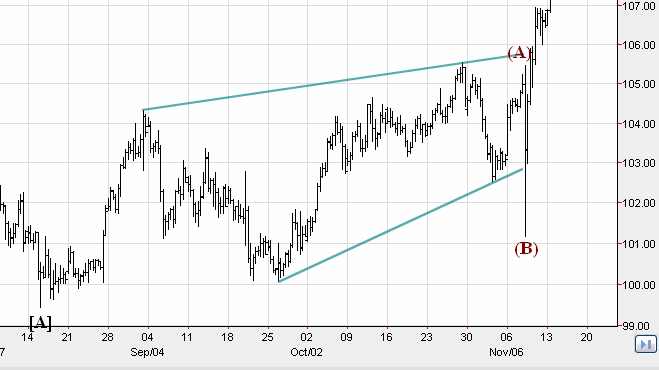
Initial triangle, which we have found.
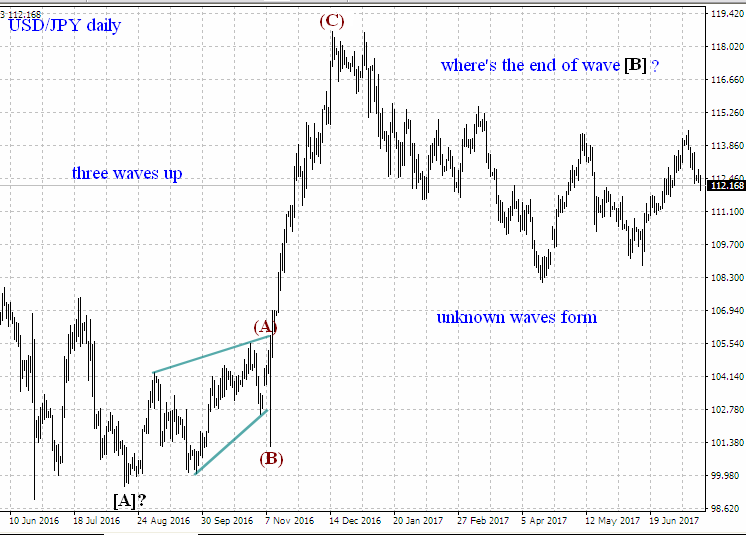
A clumsy construction with unknown waves count. The main question now, is wave [B] over?
The best decision now, to wait. If we would have zigzag [A]-[B]-[C] as wave II, then wave [C] should prove itself, unfolding as an impulse or ending triangle. After that we could search for a place to BUY USD against yen for a long term. No deals until then. Wave II should unfold itself. Wait and count.
USD/CAD spot.
We expect reverse on USD/CAD, the whole move down looks complete. US dollar strength is awaited on all major currencies. Pullback may be very high. SELL is definitely not a deal anymore. In our next issue we shall present our targets for an upward CAD correction.
Bitcoin/USD, spot.
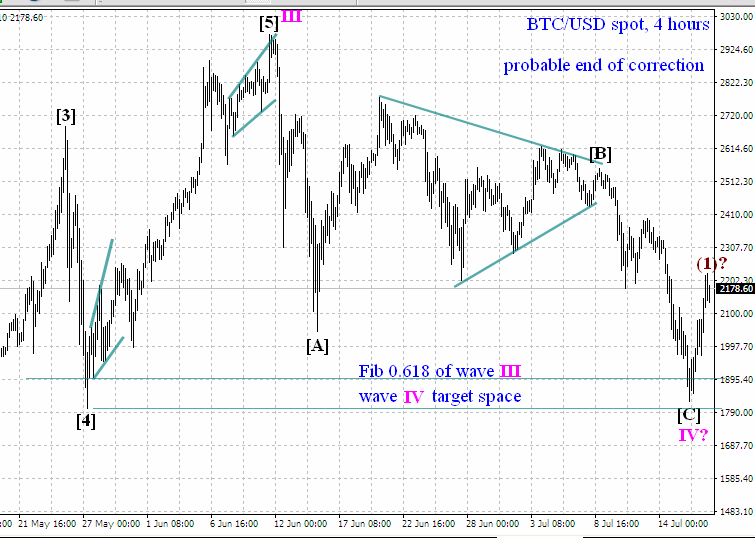
Three waves move in wave IV has reached all price targets and looks complete. Price has dropped precisely into our target space. Maybe wave V has already started and we may see its first move up. Bitcoin will rise once again, its followers ethereum, litecoin and others should follow their leader and make their own final moves up.
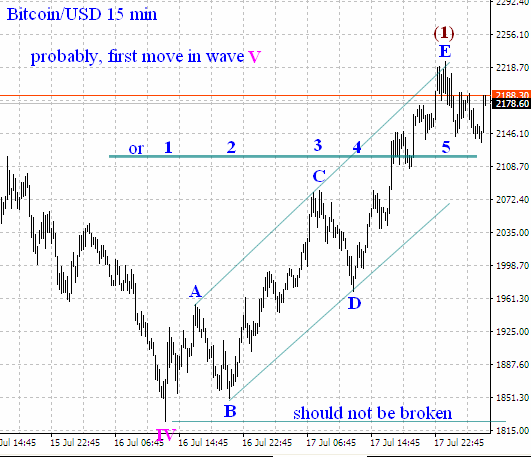
Possible first move up in wave V.
Disclosure: None of the information or opinions expressed in this blog constitutes a solicitation for the purchase or sale of any security or other instrument. Nothing in this article constitutes investment advice and any recommendations that June be contained herein have not been based upon a consideration of the investment objectives, financial situation or particular needs of any specific recipient. Any purchase or sale activity in any securities or other instrument should be based upon your own analysis and conclusions.
by Artyom Chefranov
