Eyes on today Eurozone CPI data.
Increasing wages (under solid Employment Change figures) and improving Trade Balance are the latest good news for the EUR.
The greenback regained strength after Paul Ryan (U.S. House of Representatives Speaker) said that a tax plan is set to be released next days and after Trump succeeded to raise the debt ceiling.
On the other hand, last U.S. industrial and manufacturing production unexpectedly fell in August and U.S. producer price inflation increased less than expected. In addition, the U.S. Commerce Department said last retail sales change was surprisingly negative.
During his last ECB Press Conference, President Draghi said that growth forecasts for the Eurozone will keep on the good pace though inflation is doing worse than expected. Growth projections were made considering EUR/USD at 1.18 level (the current or higher levels are considered due to excessive volatility and this is considered to be slowing down CPI measures) and in October some clearer actions will be taken in order to push inflation upwards (possibly by monitoring EUR/USD and reducing overshooting in EUR currency levels).
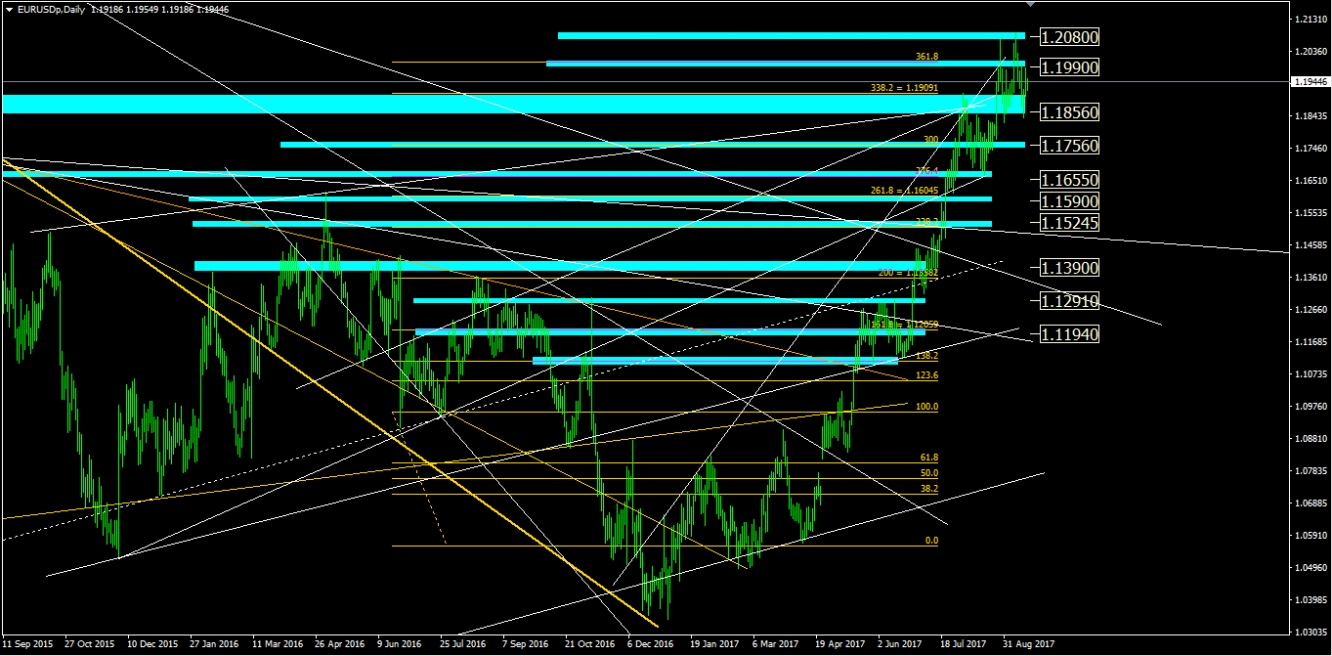
Fake breakout of 1.199 was re-absorbed as we thought very probable. Now, if 1.1856 will be clearly violated then we see room down to the next Support area (1.176). In the opposite case, 1.20 area will be definitely violated and we see room up to 1.21 area.
Our special Fibo Retracement is confirming the following S/R levels against the monthly and weekly trendlines obtained by connecting the relevant highs and lows back to 2012:
Weekly Trend: Neutral
1st Resistance: 1.1990
2nd Resistance: 1.2080
1st Support: 1.1856
2nd Support: 1.1756
Today BoE Governor Carney is to speak, let’s pay attention to this.
Longer than 1 year ago, Brexit happened and now London is starting to do an analysis about Brexit effects and outcome.
- GDP slowed down (it is the Eurozone Slowest growth, even Greece grew more)
- High Consumer Price (with freezed wages and salaries, the effect is a widespread social impoverishment)
- Hard Brexit was just only a rumor: London is starting to understand that Brexit is a jump into nowhere (especially as far as financial sectors are concerned).
The BoE’s monetary policy committee voted 7-to-2 to leave interest rates at their current record low of 0.25% following its policy meeting, but the bank said in its rate statement that the economy is looking slightly stronger than expected. A majority of officials believe borrowing costs will need to rise in the coming months to bring annual inflation back to its 2% goal. Such a move is likely “over the coming months,” the statement said if the economy performs broadly in line with officials’ expectations.
On the other hand, 5 terroristic attacks in Britain this year and upcoming German elections are undermining the volatile stamina for the GBP bulls.
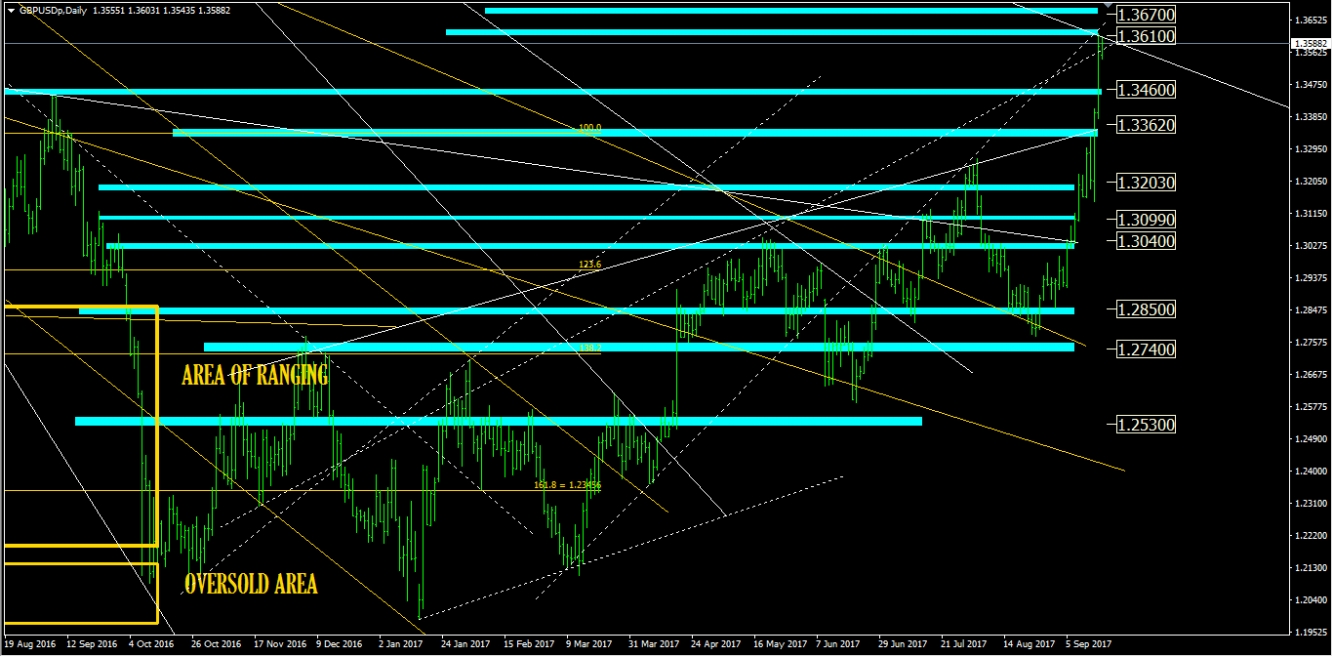
We think that 1.36 is a definitive very strong Resistance so GBP is overbought now and 1.3460 should be re-tested as GBP/USD current fair value. In the case of upside overshooting continuation, 1.367 Resistance area will probably block the bulls creating a downside correction.
Our special Fibo Retracement is confirming the following S/R levels against the monthly and weekly trendlines obtained by connecting the relevant highs and lows back to 2001:
Weekly Trend: Overbought
1st Resistance: 1.3610
2nd Resistance: 1.3670
1st Support: 1.3460
2nd Support: 1.3362
Pay attention to RBA Minutes Meeting later today.
Australia reported improved job market and interestingly good home loans data for July, but Trade Balance and Retail Sales worse than expected, and GDP on the downbeat too.
Last Australian Manufacturing Index was better than expected and private new capital expenditure for the second quarter jumped 0.8%, well above a 0.3% gain seen. Also Building Approvals and Construction Work Done better than expected.
On the other hand, last U.S. industrial and manufacturing production unexpectedly fell in August and U.S. producer price inflation increased less than expected. In addition, the U.S. Commerce Department said last retail sales change was surprisingly negative.
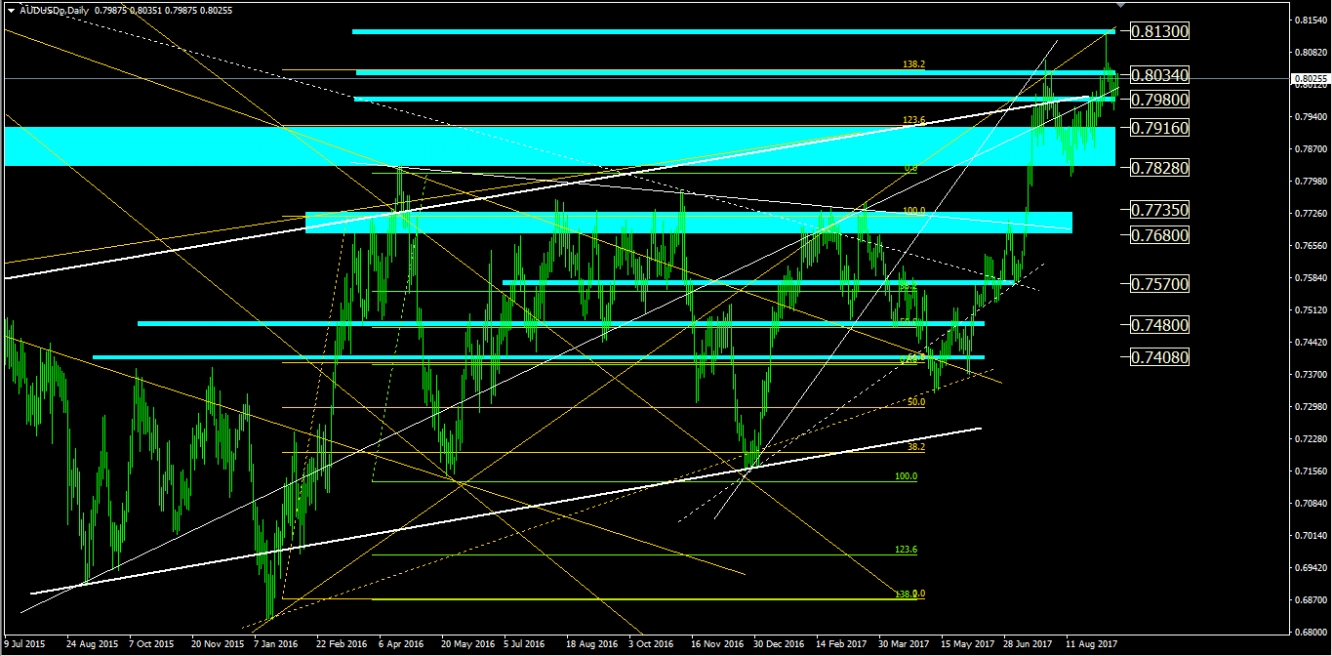
In the case of a definitive breakout of 0.803 area, then there is room up over 0.804 until 0.81 area. In the opposite case, a re-test in area 0.798 will lead down to the main Support in area 0.792.
Our special Fibo Retracements are confirming the following S/R levels against the monthly and weekly trendlines obtained by connecting the relevant highs and lows back to 2012:
Weekly Trend: Neutral
1st Resistance: 0.8034
2nd Resistance: 0.8130
1st Support: 0.7980
2nd Support: 0.7916


