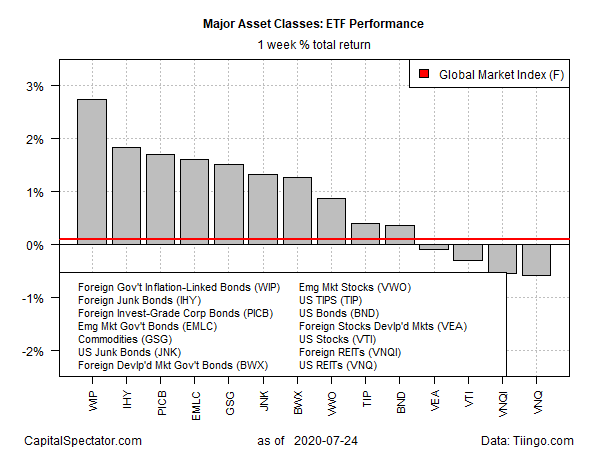
Government bonds linked to inflation in foreign markets topped returns for the major asset classes, based on a set of exchange traded funds. Other slices of the offshore fixed-income landscape also delivered strong results for the trading week through July 24.
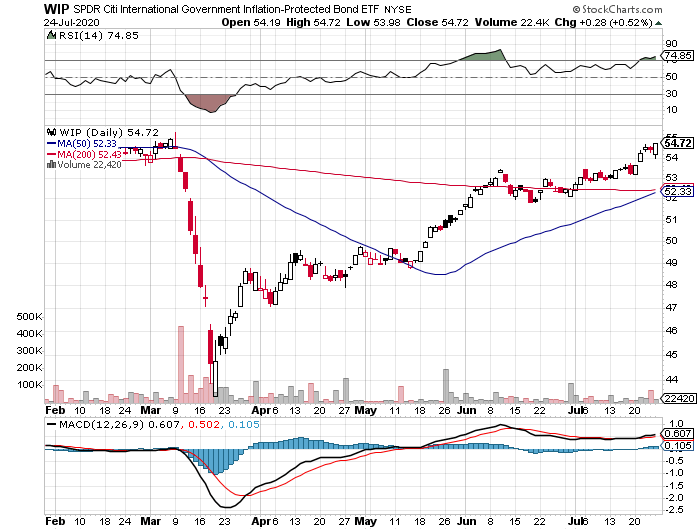
SPDR FTSE International Government Inflation-Protected Bond (WIP) rose 2.7% last week—the top performance and the fund’s best weekly gain in two months. WIP closed on Friday at its highest price since Mar. 6.
A key factor in WIP’s gain: the sliding value of the US dollar relative to foreign currencies. A bearish trend in the buck is usually beneficial to foreign assets denominated in greenbacks.
“A weaker dollar doesn’t necessarily reflect a weak US economy but reflects a stronger global economy on a relative basis,” says Jeffrey Schulze, an investment strategist at ClearBridge Investments.

The US dollar index fell a hefty 1.6% last week, marking the fifth straight week of decline. This benchmark, which measures the dollar’s value via a basket of major currencies, ended the week at its lowest level since October 2018.
Not surprisingly, the dollar tailwind supported other corners of foreign bonds last week. Foreign junk bonds posted the second-best return for the major asset classes. VanEck Vectors International High Yield Bond (IHY) jumped 1.8% last week, the fourth straight weekly gain for the ETF.
Last week’s biggest loser among the major asset classes: US real estate investment trusts (REITs). Vanguard Real Estate (VNQ), which has been trading in a tight range for the past two weeks, slipped 0.6%.
The Global Markets Index (GMI.F) eked out a fractional gain last week. This unmanaged benchmark, which holds all the major asset classes (except cash) in market-value weights via ETFs, edged up 0.1% — the index’s fourth consecutive weekly advance.

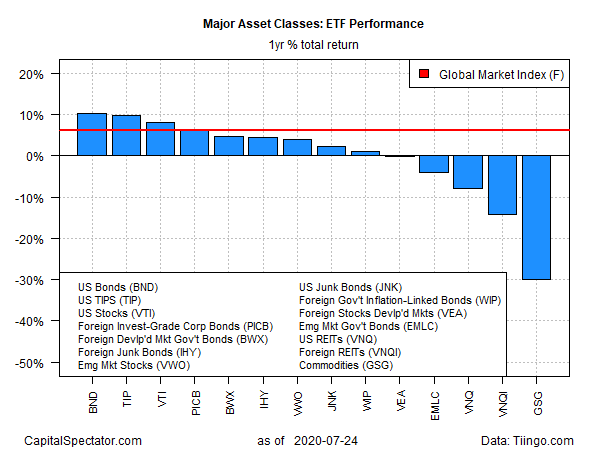
For the one-year trend, US investment-grade bonds continued to hold on to a leading performance for the major asset classes. At last week’s close, Vanguard Total Bond Market (BND) posted a 10.3% total return.
Broadly defined, commodities are still the worst one-year performer: the iShares S&P GSCI Commodity-Indexed Trust iShares (GSG) was off 30% at last week’s close vs. the year-earlier price.
Meanwhile, GMI.F’s one-year total return remained solidly in positive territory, ending last week with a 6.1% total return for the trailing 12-month window (252 trading days).

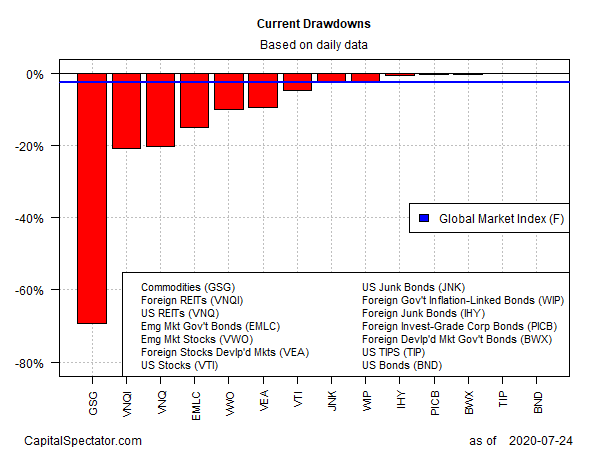
Ranking asset classes based on current drawdown continues to indicate a wide range of results: from a near-70%-peak-to-trough decline for commodities (GSG) to a virtually nil drawdown for investment-grade US bonds (BND).
GMI.F’s current drawdown is a modest -2.5%.

