
Ford Motor Co. (NYSE:F) posted adjusted earnings per share of 39 cents in the first quarter of 2017. The reported figure was 29 cents lower than that in first-quarter 2016 (excluding special items). However, earnings surpassed the Zacks Consensus Estimate of 34 cents per share. Pre-tax income (excluding special items) was $2.2 billion, about $1.6 billion lower than the year-ago quarter figure.
Net profit attributable to Ford was $1.6 billion, down $0.9 billion from the year-ago quarter figure.
Ford recorded revenues of $36.48 billion, surpassing the Zacks Consensus Estimate of $34.78 billion. Revenues were $1.3 billion higher than a year ago.
Ford Automotive
Ford recorded Automotive revenues of $36.48 billion. Revenues increased $1.3 billion on a year-over-year basis. Wholesale volumes decreased 17,000 units to stand at 1.7 million. Pre-tax profit declined to $2 billion from $3.5 billion a year ago.
In North America, revenues inched up 0.4% to $24 billion. Wholesale volumes declined 5.3% year over year to 771,000 units due to lower dealer-stock build. Further, pre-tax profit decreased to $2 billion from $3.1 billion due to commodity headwinds and higher investments, partly offset by net efficiencies across all other remaining cost categories.
In South America, revenues increased 21.4% to $1.1 billion. Wholesale volumes rose 11.1% to 70,000 units. Pre-tax loss amounted to $244 million, narrower than $256 million in the prior-year quarter. The loss was due to an improving but still weak economy.
In Europe, revenues rose 10.1% to $7.6 billion. Wholesale volumes increased 12.5% year over year to 449,000 units. The region recorded a pre-tax profit of $176 million, compared with $434 million a year ago. The downside was driven by currency headwinds as well as higher costs and investments.
In the Middle East & Africa segment, revenues declined 33.3% year over year to $0.6 billion. Wholesale volumes plunged 34.8% to 30,000 units. The region reported a pre-tax loss of $80 million, far wider than $14 million in the year-ago quarter.
In the Asia-Pacific region, revenues of $3.2 billion improved 18.5% year over year. Wholesale volumes declined 3.8% to 383,000 units. Market share in the region was 3.4%, compared with the year-ago level of 3.8%. The Asia-Pacific region reported a pre-tax profit of $124 million, down from $220 million in the year-ago quarter.
Financial Services
Ford Credit reported a 6.4% decline in pre-tax profit to $481 million in the first quarter of 2017, as expected.
Ford Motor Company Price, Consensus and EPS Surprise
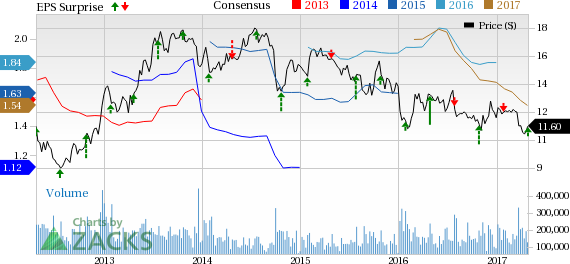
Ford Motor Company Price, Consensus and EPS Surprise | Ford Motor Company Quote
Financial Position
Ford had cash and cash equivalents of $17.8 billion as of Mar 31, 2017, up from $15.9 billion as of Dec 31, 2016. As of Mar 31, 2017, Automotive debt increased to $16.2 billion from $15.9 billion as of Dec 31, 2016.
In first-quarter 2017, the company’s cash flow from continuing operations decreased to $4.1 billion from $4.3 billion a year ago. Capital expenditures declined to $1.5 billion from $1.7 billion in first-quarter 2016.
2017 Guidance
Ford expects 2017 pre-tax profit to be about $9 billion, lower than $10.4 billion in 2016. This is due to higher investments in electrification, autonomy and mobility.
The 2017 margin in North America is expected to be below the 2016 level. Further, Ford expects the loss in South America to improve as the economy recovers. In Europe, the company anticipates lower profits than 2016. In the Middle East and Africa unit, it expects to record better performance. In the Asia-Pacific, Ford estimates pre-tax profit to be higher than the 2016 level.
Moreover, the automaker projects Ford Credit’s profits in 2017 to be about $1.5 billion, lower than the 2016 level of $1.9 billion.
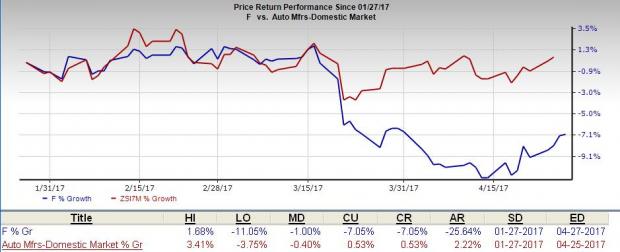
Price Performance
The Ford stock has underperformed the Zacks categorized Auto Manufacturers-Domestic industry in the last three months. This was due to poor guidance for 2017. Share price of the stock decreased 7.1% over this period, while the industry saw a 0.5% gain.
Zacks Rank and Top Picks
Ford currently carries a Zacks Rank #3 (Hold).
Better-ranked companies in the auto space include Oshkosh Corp. (NYSE:OSK) , Fox Factory Holding Corp (NYSE:F) and Lear Corp. (NYSE:LEA) . All the stocks carry a Zacks Rank #2 (Buy). You can see the complete list of today’s Zacks #1 Rank (Strong Buy) stocks here.
Oshkosh has an expected long-term growth rate of 10.6%.
Fox Factory has an expected long-term growth rate of around 16.1%.
The expected long-term growth rate for Lear is pegged at 8.9%.
The Best & Worst of Zacks
Today you are invited to download the full, up-to-the-minute list of 220 Zacks Rank #1 "Strong Buys" free of charge. From 1988 through 2015 this list has averaged a stellar gain of +25% per year. Plus, you may download 220 Zacks Rank #5 "Strong Sells." Even though this list holds many stocks that seem to be solid, it has historically performed 6X worse than the market. See these critical buys and sells free >>
Ford Motor Company (F): Free Stock Analysis Report
Fox Factory Holding Corp. (FOXF): Free Stock Analysis Report
Lear Corporation (LEA): Free Stock Analysis Report
Oshkosh Corporation (OSK): Free Stock Analysis Report
Original post
Zacks Investment Research