The US dollar was seen strengthening on the day after data showed that consumer prices had increased 0.2% on the month as expected. Core inflation rate increased 0.2%, beating estimates of a 0.1% increase.
In the European trading session, the UK's labor market data showed that average earnings including bonuses increased just 2.5% as forecast and was slower than the previous month's print of 2.6%. The UK's unemployment rate held steady at 4.2%.
The economic calendar is busy today starting with the release of the UK's inflation data. Economists forecast that consumer prices increased 2.4% on the year ending May 2018. This would mark the same pace of increase compared to the previous month's data. Core CPI is also expected to rise at a pace of 2.1%.
Data from the eurozone will focus on the quarterly employment change. The report is expected to show a 0.3% increase marking a same pace of increase compared to the previous quarter.
In the NY trading session, following the release of the producer prices index data, the FOMC meeting becomes the focus. The Federal Reserve is expected to hike interest rates by 25 basis points and will also release the economic projections and the press conference chaired by Jerome Powell.
EUR/USD intra-day analysis

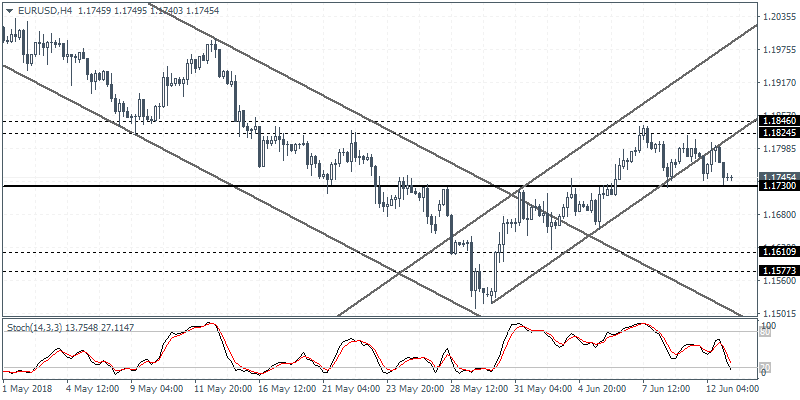
EUR/USD (1.1745): The EUR/USD currency pair was seen closing bearish on Tuesday as price action fell back to the support level of 1.1730. With the daily chart signaling a hidden bearish resistance, a break down below the support level could signal further declines. As price trades outside the minor rising price channel, the support level is likely to be critical. In the near term, we expect the EUR/USD to maintain the range between 1.1846 - 1.1825 level of resistance and 1.1730 support. The pending retest of support at 1.1610 - 1.1577 is most likely to be the downside target in case the support gives way.
USD/JPY intra-day analysis

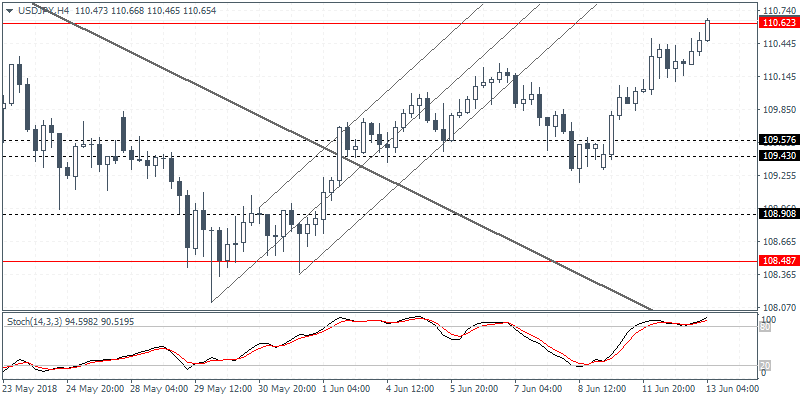
USD/JPY (110.65): The USD/JPY currency pair managed to post strong gains with price action, seen currently testing the resistance level at 110.62. A breakout above this level is essential in order to post further gains. However, we expect to see the USD/JPY maintaining its range within the resistance level and the lower support at 109.57 in the near term. An unlikely breakout above 110.62 could signal further gains that could push the currency pair to highs of 111.37 that was briefly tested previously.
XAU/USD intra-day analysis

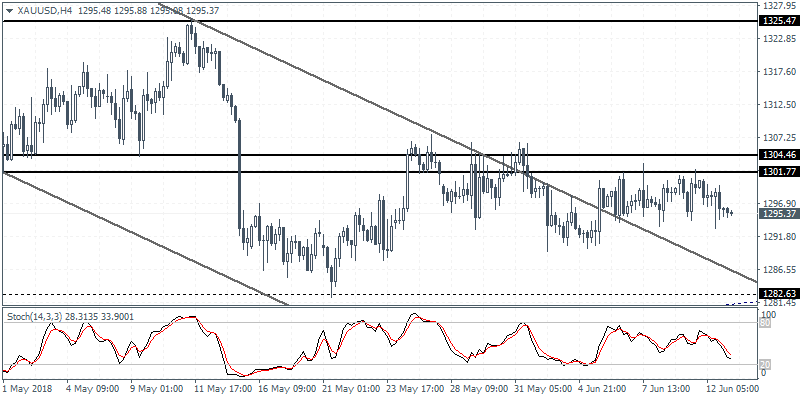
XAU/USD (1295.37): The consolidation in gold prices continues with price action failing to clear the resistance level of 1304 - 1301 region. This sideways range is expected to be breached heading into today's FOMC meeting. The downside support at 1282 remains a key level of interest while the resistance level at 1325 could be reached on a close above the resistance level.
