A dovish FOMC keeps oil’s bull run alive and boosts gold’s march higher.
OIL
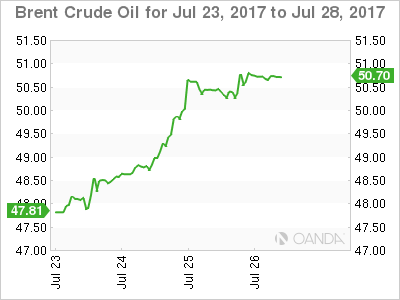
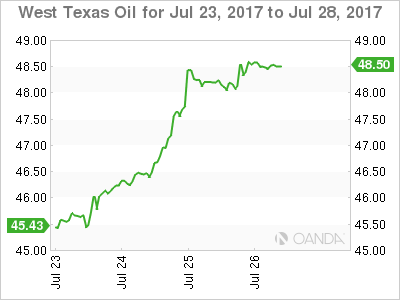
Much was made overnight of oil’s positive price action but in fact it has left me somewhat underwhelmed. With the U.S. DOE Crude Inventories delivering a mighty 7.2 million drawdown against an expected 2.6 million drawdown, and following a dovish FOMC, all Brent and WTI spot could do yesterday was make back the losses they had suffered on the day to finish mostly unchanged.
In itself this should not be construed as bearish. As previously stated, more aggressive cuts from Saudi Arabia and most importantly, a possibly impending bankruptcy of Venezuela, along with an increasingly clear trend of inventory drawdowns in the U.S. should be constructive for prices. Or at least hold them around the $50.00 a barrel. The fact that we could not rally on such a large drawdown overnight though may suggest that after a mighty run higher in prices over the last week, perhaps a lot of good news is built into the price for now. This may be cause for shorter term traders to pause for breath for now.
On a positive note, both contracts held their 100-day moving averages on the pre-inventory pull back action yesterday. Although we note that the 200-day moving averages remain unchallenged on both contracts suggesting chopping price action between the two for now.
Brent spot is trading at 50.75 with the 100-day average nearly at 50.40 lending support followed by the 50.00 level. Resistance is at the 200-day average at 51.40 with the next resistance at 52.70.

WTI spot trades at 48.50 with the 100-day supporting at 47.70. The 200-day lies above at 49.15 followed by the mystical 50.00 pivot point.

GOLD
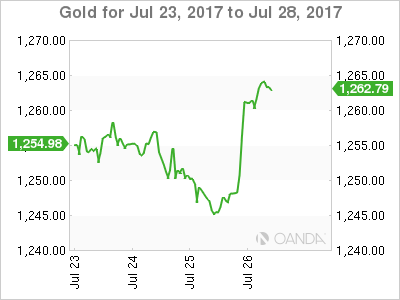
The FOMC came to gold’s rescue overnight as the yellow metal unwound what was potentially a profit taking day and rose a healthy 0.90% to close in New York around 1261.00 from a 1250.00 opening. The FOMC’s admission that inflation remains “subdued” and that the balance sheet unwinding will start “soon” saw the U.S. dollar red carded and stretchered off the pitch in both the FX and metals markets.
In addition to gold’s much higher close, it also tested but held its 100-day moving average at 1249.10 before closing much higher. This is a pleasing technical development for gold bulls out there. The U.S. Senate’s latest failure to repeal Obamacare and their impending Russian sanctions vote should also be enough to keep the uncertainty premium in gold percolating nicely in the back ground.
Asian demand has seen gold drift higher by three dollars to 1264.00 this morning as the FOMC fallout continues across the G-10 currency space. Support lies at 1259.60 initially followed by the 100-day average at 1249.10. Resistance is at 1267.00 intra-day with a daily close above implying a march to the 1281.00 regions is on the cards.

